Windows users unable to log in
Your help desk has been taking calls from users unable to log in. Several analysts on an incident bridge have been investigating for the last few hours, but nobody seems to be sure what is causing the problem. As an analyst, you need to find the root cause of the problem, and work out who to refer the issue to next.
How to use Splunk software for this use case
Ensure you're collecting enough data to ensure you can troubleshoot across all of your systems. By collecting, retaining, and searching all data, Splunk provides complete visibility across time, allowing operations teams to answer fundamental questions about system behavior and more.
- From the default Splunk home screen, click Search & Reporting.
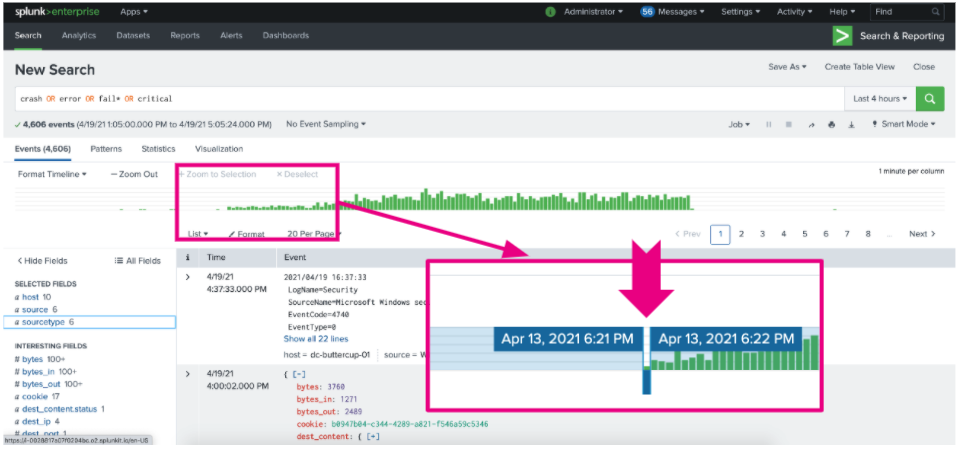
- Run a search with the following criteria:
- Select the timeframe you want to search within, for example, the last 4 hours. You can optimize it further by specifying an index.
- Search for keywords that you might expect to see within the data during an incident or outage. Search for single keywords or broaden the search more by adding the boolean expression OR into the search. You can also use a wildcard character to search for any keyword that starts with fail, such as failed, failing, failure. If a problem is occurring in the environment, you might expect to see a lot of these types of events. An example search could be:
crash OR error OR fail* OR critical
- Run the search and check the events that return. Use the histogram to spot trends and outliers and pinpoint when the problem started. You can click on a green bar to see more information about the timeframe and events occurring at that time. Now you can focus your investigation around a short window of time.
- Check fields of interest on the left side of the screen using the fields sidebar, which lists every field found within the data. Clicking on each field helps to answer additional questions you might ask during an investigation. Some fields you might want to investigate include:
- Click hosts to find out which hosts are currently reporting errors and appear to be affected.
- Click sourcetype to check the status of every piece of technology in the environment, for example, web servers, database servers, or the network.
- Focus your investigation. Since users were complaining about inability to authenticate, you could focus the investigation down to the authentication servers. You can do this by clicking on the first auth server displayed within sourcetype. You'll notice that Splunk automatically adds a field/value filter to the search, and from there you can then add a wildcard character to look across all auth servers. Your search should look like this:
crash OR error OR fail* OR critical host="auth-x*"
- Look through the data on the auth servers to locate trends or correlations that reveal root cause. For example, if every error in the webserver is correlated to a stacktrace error in the java code, you can expand the stacktrack event to see that it indicates that the call to the database failed. That indicates to you that the database team should be contacted to help you troubleshoot further.
Next steps
Once you've found the source of the problem, you may want to re-run the search using a longer timeframe, for example, the year to date. This allows you to determine when a problem was first introduced into the environment and find out how long a problem has been going on for. You could also focus in on a specific date and time range to see what might have occurred in the environment at some specific and important point in time, such as right after a system patching event.
Finally, you might be interested in other processes associated with the Investigating user login issues and account lockouts use case.