Predicting service outages before they occur
You can use historical KPI data and machine learning algorithms in Splunk ITSI to predict an outage 20-30 minutes before it happens. This process works best when a service has more than 5 good KPIs and more than 1 week of historical data.
The machine learning algorithm looks for recognizable/predictable KPI behavior, which comes before the service's aggregate health score changes. You can use machine learning within Splunk ITSI to build a model for the service you want to track.
Build a model
- Open Splunk ITSI and in the top toolbar click Configuration, then Services.
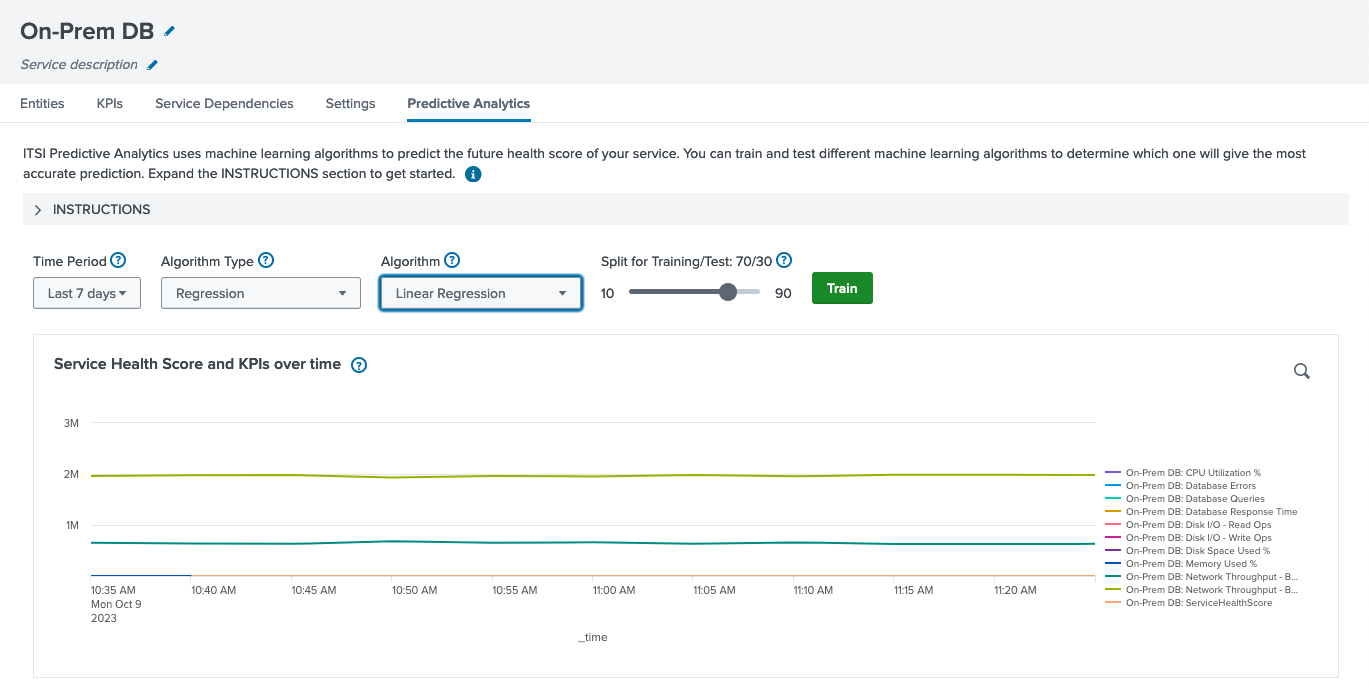
- In the list of services, find the service you want to track. Click the Edit drop-down box to the right of the service name, then click Predictive Analytics.
- On this screen you will train and test different machine learning algorithms to determine which one gives the most accurate prediction. Use the instructions on-screen to select a time, algorithm type and algorithm, and click the Train button.
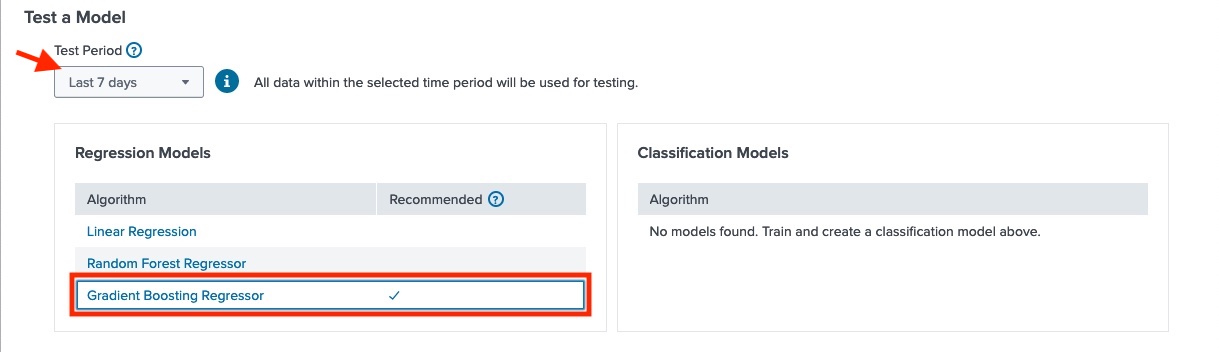
- After the model has run, investigate the results, and click Save.
- Test out other algorithms by repeating steps 3 and 4. Note that the recommended model is the model that closely predicts a service’s health score. The recommendation might not be accurate if you change the test period.
Review the Predictive Analytics score and add it to a glass table
- Open Splunk ITSI and in the top toolbar click Dashboards, then Predictive Analytics.
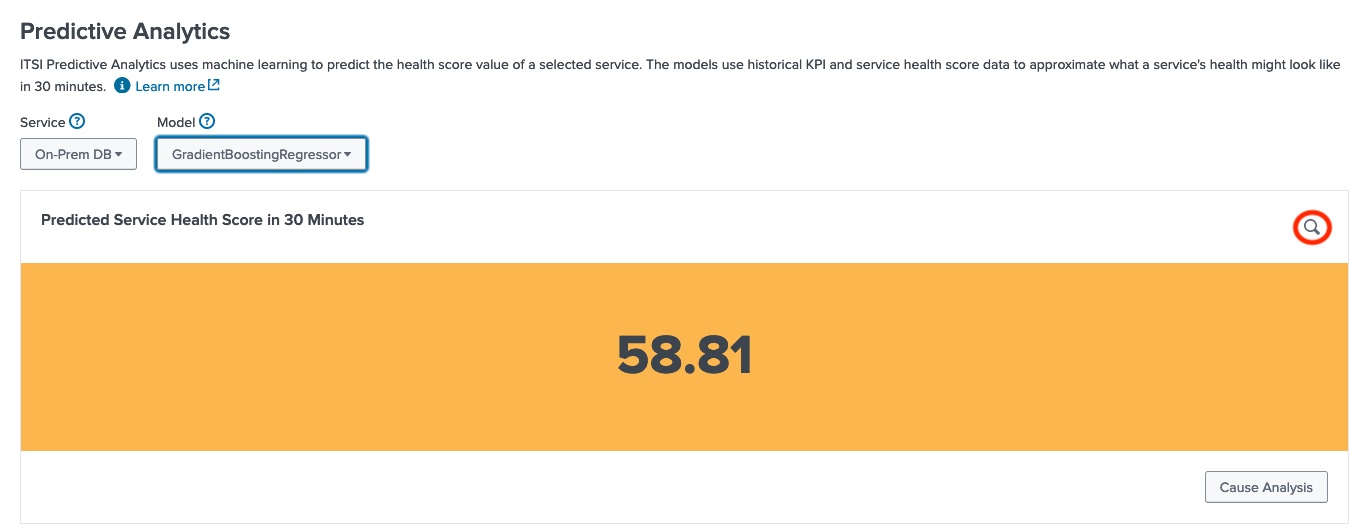
- In the list of services, find the service you want to track, and select the recommended algorithm model.
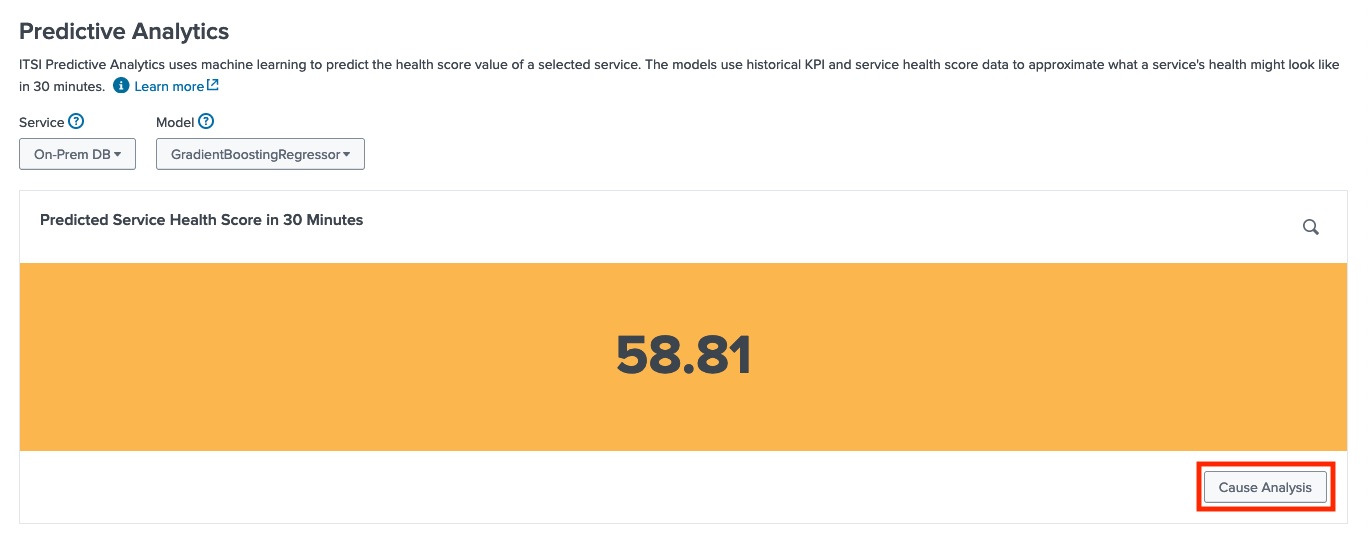
- After you have selected a model, Splunk ITSI will calculate the future Service Health Score. Click the Cause Analysis button to review the suggested KPIs.
- Click the spyglass icon
to review the SPL. Save it to a notepad to copy it into a glass table later.
- In the Splunk ITSI top toolbar, click Glass Tables and select the glass table you'd like to add this score to.
- Select the Data Overview icon
and click Create Ad hoc search.
- Provide a Data Source Name and paste the copied search string into Search with SPL box.
- Click Apply & Close.
- Select the ad hoc search you created to add it to the glass table. This adds a new ad-hoc visualization to the glass table.
- Select the ad-hoc visualization. In the Configuration panel, select your desired threshold setting by clicking the desired Selected Data Field dropdown:
- Next30m_avg_hs (number) displays the average prediction.
- Next30m_worst_hs (number) displays the worst case prediction.
- (Optional) Add dynamic color thresholding to predictive analytics visualizations using the Coloring section in the Configuration panel. For more information, see configuration options for single value and single value icon visualizations.
- (Optional) Add a drilldown to the Predictive Analytics dashboard using the Drilldown Settings section in the Configuration panel.
- Click + Add Drilldown
- For On Click, choose the Link to custom URL option.
- In a separate ITSI window, navigate to Dashboards > Predictive Analytics. Select the service and corresponding model to display the heath score prediction. Copy the URL.
- Paste the URL you just copied into the URL field in the Configuration panel.
- Click Apply to save your configuration.
- Select a Visualization Type in the Configuration panel. You cannot use the sparkline or trending value visualization types because the prediction is a static value.
- Click the Save icon.