Troubleshooting a service latency issue related to a database query
In Splunk Application Performance Monitoring, you have detectors set up to monitor service latency. As an SRE, you need to be able to troubleshoot latency issues caused by a database query. These latency issues might be the root cause of digital experience, service performance, or other Service Level Indicator (SLI) deviations.
As part of DevOps process improvement strategy, you might also be interested in answering the following questions:
- How can we easily correlate database query and hosting performance with application performance to determine root cause for a transaction latency condition?
- How can we make sure the database performance can be visualized and observed as part of the Splunk Application Performance Monitoring traces in real time and in full-trace fidelity?
- How can we easily understand database impact to other services and the overall customer digital experience?
Solution
You can resolve this scenario with Splunk Application Performance Monitoring’s Database Query Performance capability.
In this scenario, your leadership team are looking to get a better understanding of how critical databases impact both SQL and non-SQL database applications. As part of their observability strategy to drive efficiencies, they want a proactive operational workflow. The workflow should start with an identified application latency issue, followed by the ability to quickly determine if the latency root cause is the application calls to the database or the performance of the hosting database instance.
Your organization has engineered the use of Redis enterprise clusters for global caching services in support of their microservice architecture and application development framework. Leadership wants to assure their tier one application portfolio, including the company's flagship sales portal, has no observable blind spots as it relates to the new content caching database architecture.
Overall, your organization wants to:
- Improve the ability for an SRE to quickly troubleshoot transactional latency issues caused by slow database queries/calls, poor Redis database instance performance or low Cache Hit Rate percentages.
- Improve the ability to reduce incident MTTD (Mean time to Detect) and MTTR (Mean time to Resolution) for application transactions being impacted by database calls or degraded database instance performance.
Process
Your company’s sales portal consumes a microservice, called cartservice, where a new version has been deployed that optimizes Redis database caching. The service development team just introduced the new version as part of the DevOps CI/CD pipeline using their canary deployment methodology.
A Splunk Application Performance Monitoring latency detector has been deployed and has alerted on the frontend service. You are the SRE on call who receives the notification.
Here is how the detector has been set up:
.png?revision=1)
The detector triggers an alert when the latency exceeds threshold. Here is an example alert:
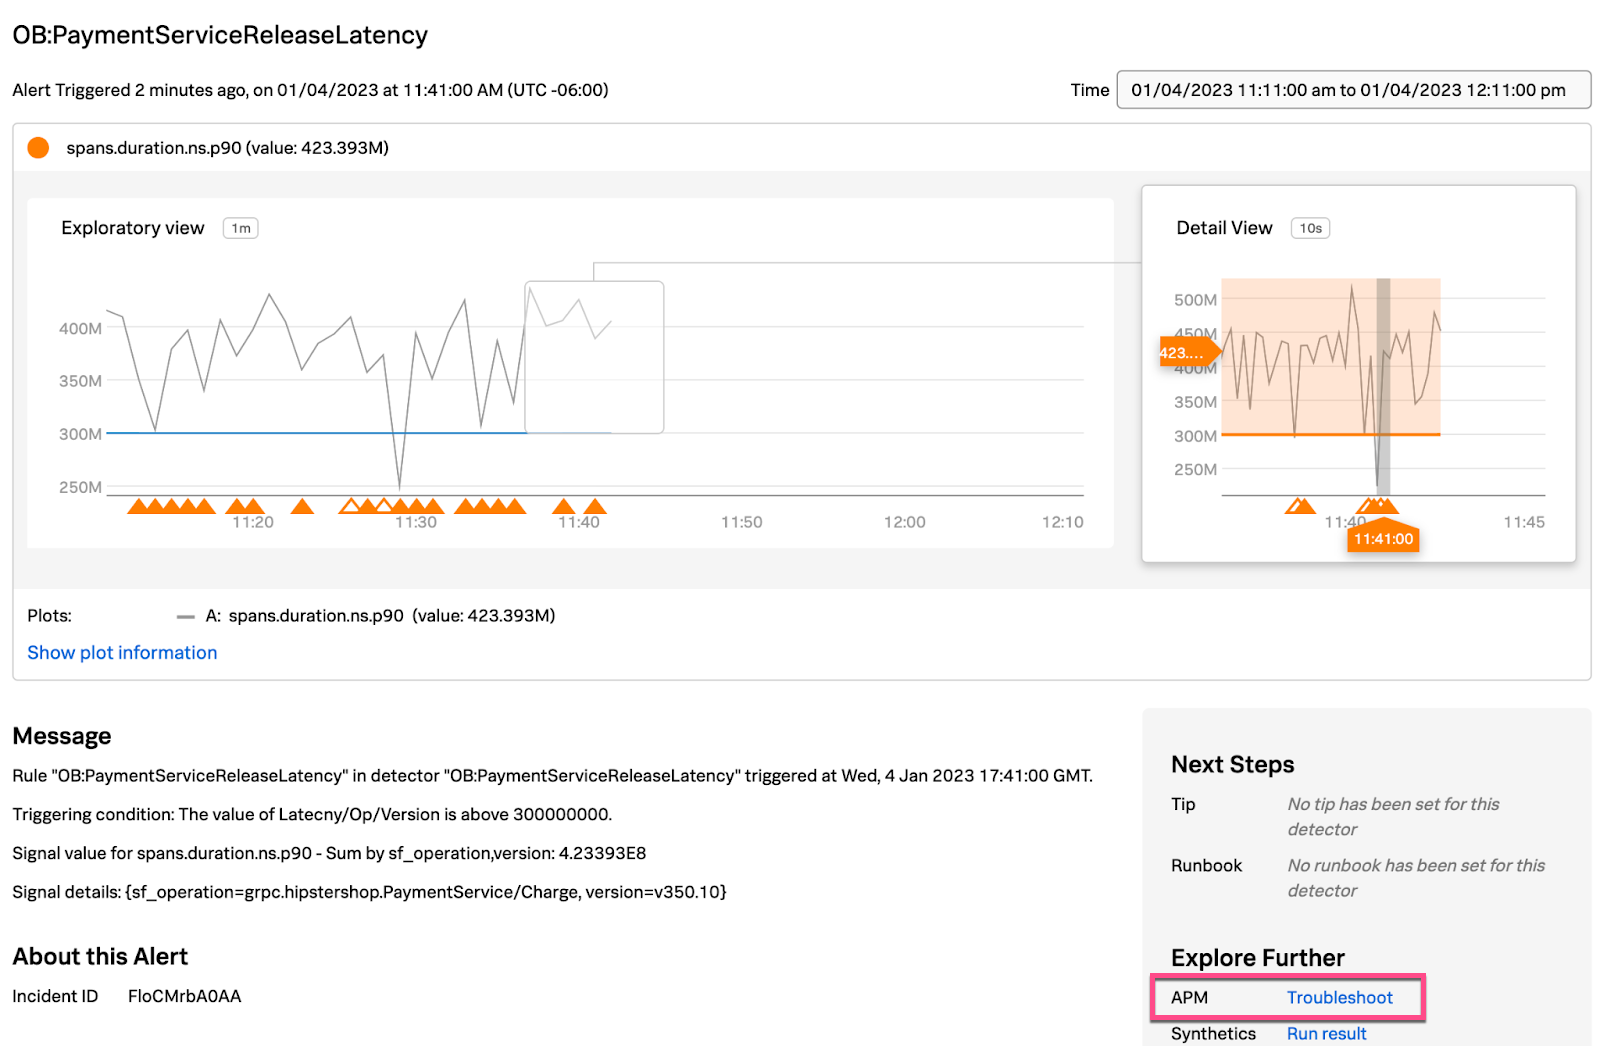
- Select the APM Troubleshoot link in the alert, shown above, to review the OnlineBoutique APM Service Map.
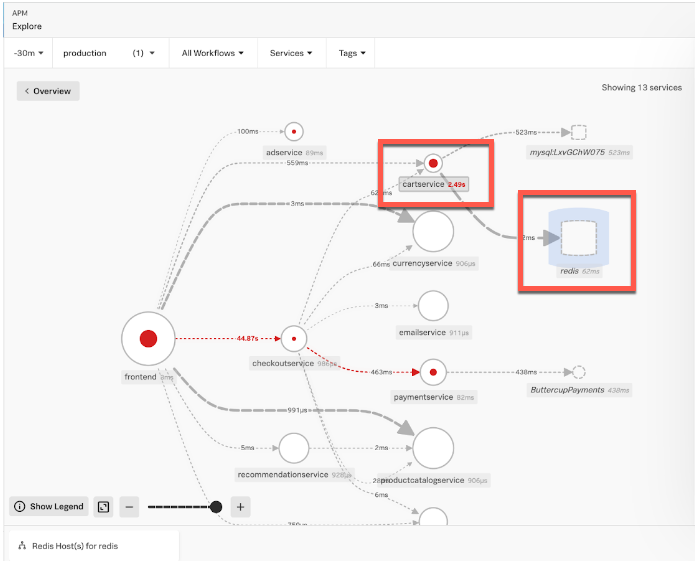
- In the Service Map shown below, you can see the performance degradation of the inferred Redis database instance used by the cartservice. You can also see that the cartservice is having a latency issue communicating to the Redis database. Click the redis inferred database in the Service Map to access Database Query Performance information.
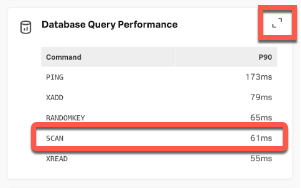
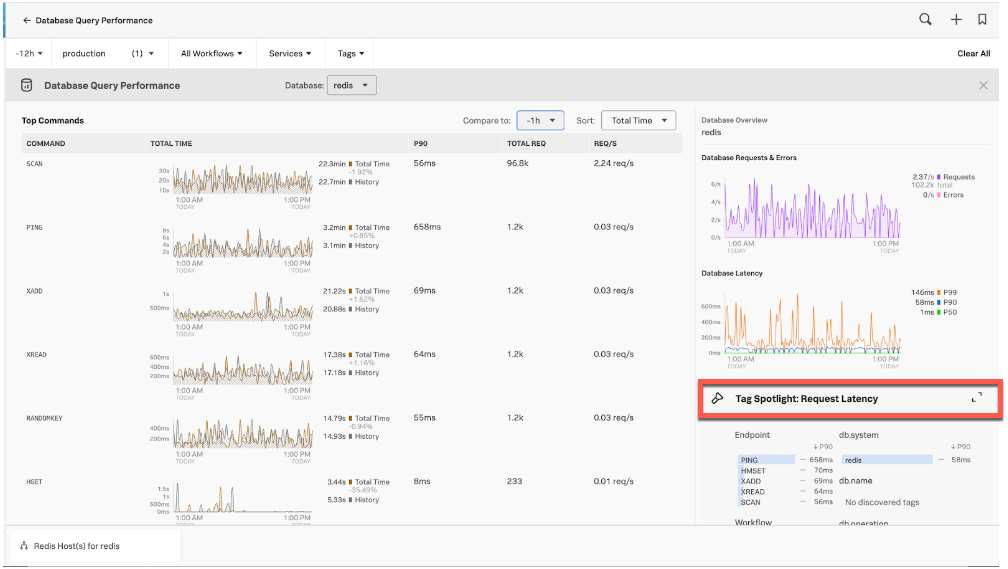
- Here you can see that latency appears normal for the Redis commands since SCAN is returning 61ms. To drill down deeper, open Database Query Performance by using the expand icon < > at the top-right of this section:
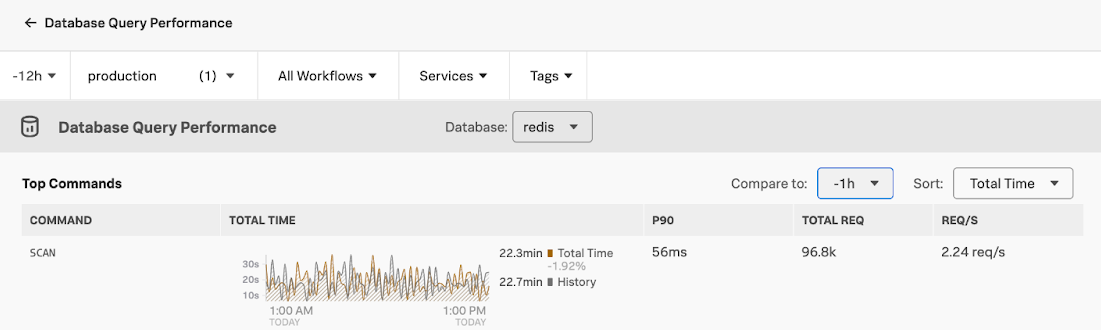
- Here you can see that the amount of SCAN command requests, 96.5k, is unusually high compared to the other commands. The Total Time of 22.3min is also unusually high. From experience, you know that SCANs are not normally used in production services:
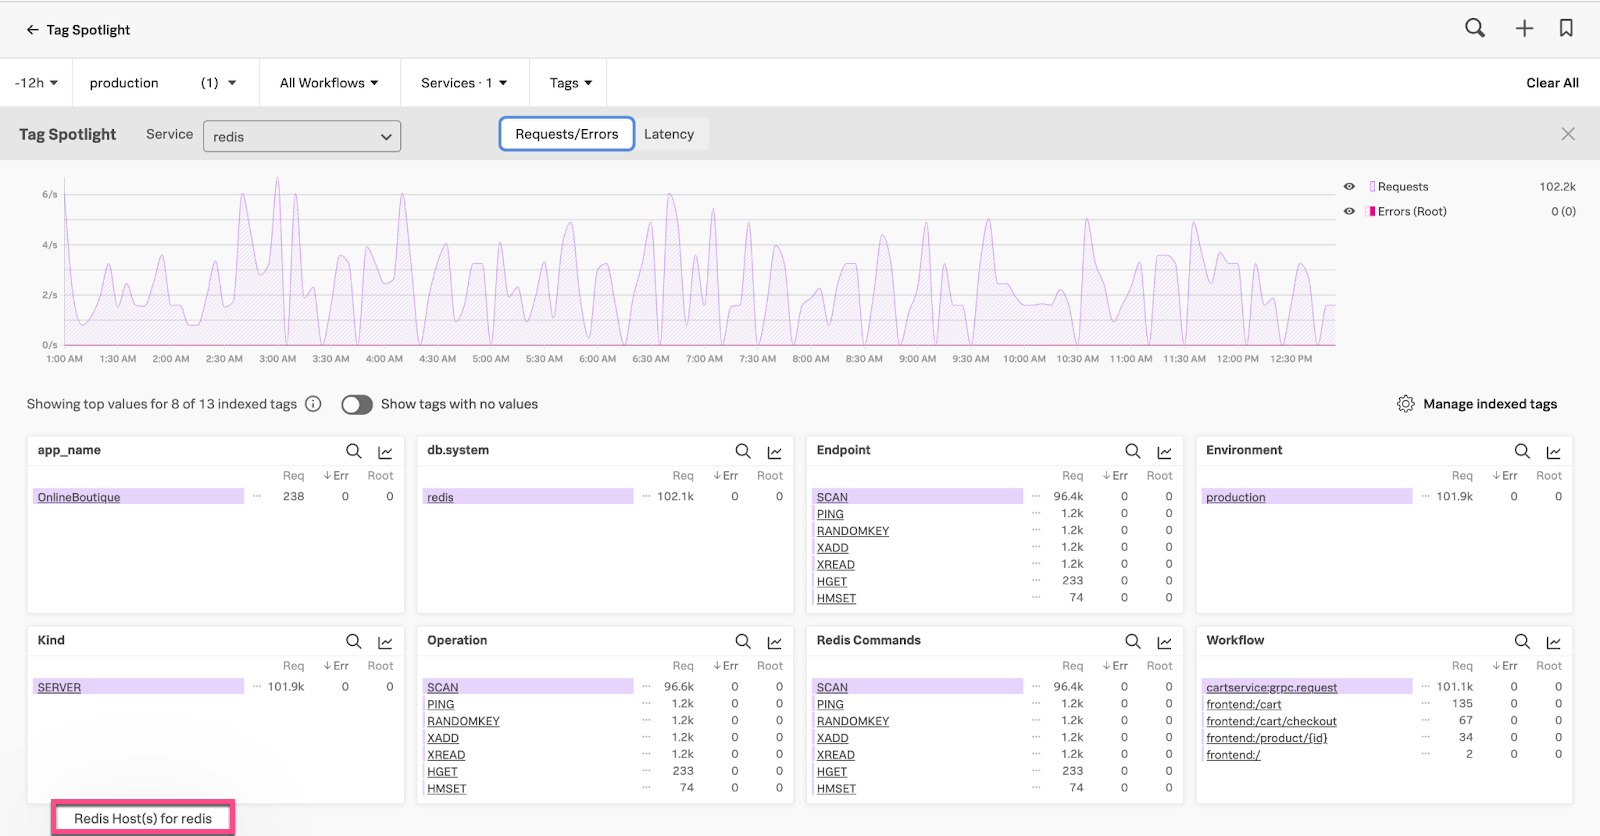
- To drill down deeper, open Tag Spotlight: Request Latency by using the expand icon < > at the top-right of this section:
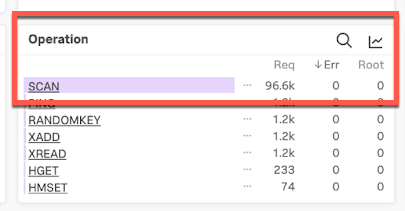
- Looking at the Operation pane in Tag Spotlight you can see the high number of SCAN requests. Double-click SCAN to filter for only SCAN spans:
- On the chart showing the filtered SCAN spans, click a high peak:
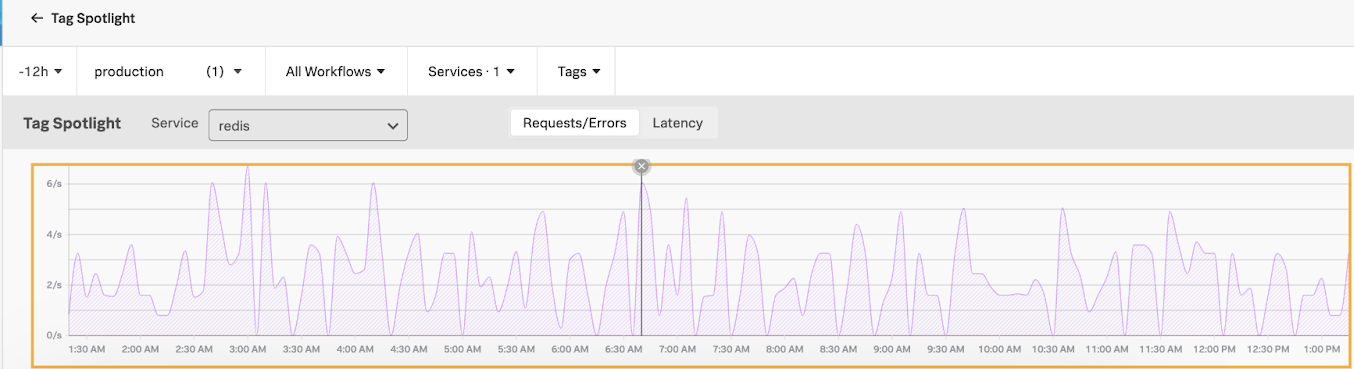
- This brings up a number of traces. Click a trace to examine it further:
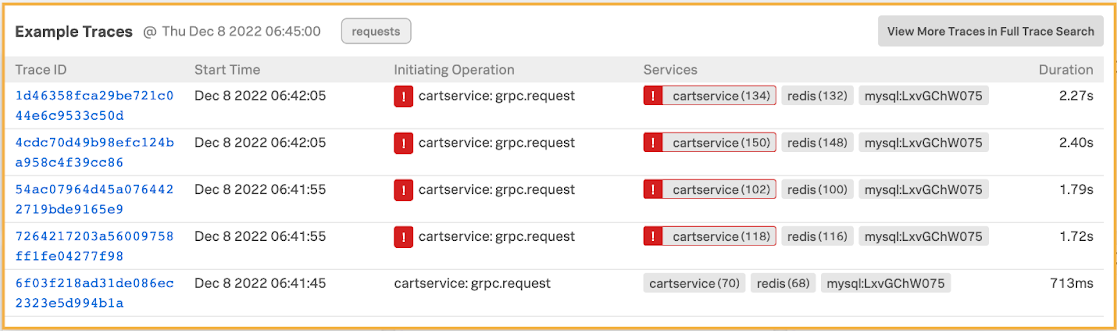
- Click the trace UI’s Span Performance tab. Here you can see 128 SCAN spans for a single trace, and one scan is taking over a second to complete, which is high. The SCAN is also consuming 89.7% of the total workload. Given this information, you conclude this is the root cause for the
cartservicelatency identified by the originating alert:
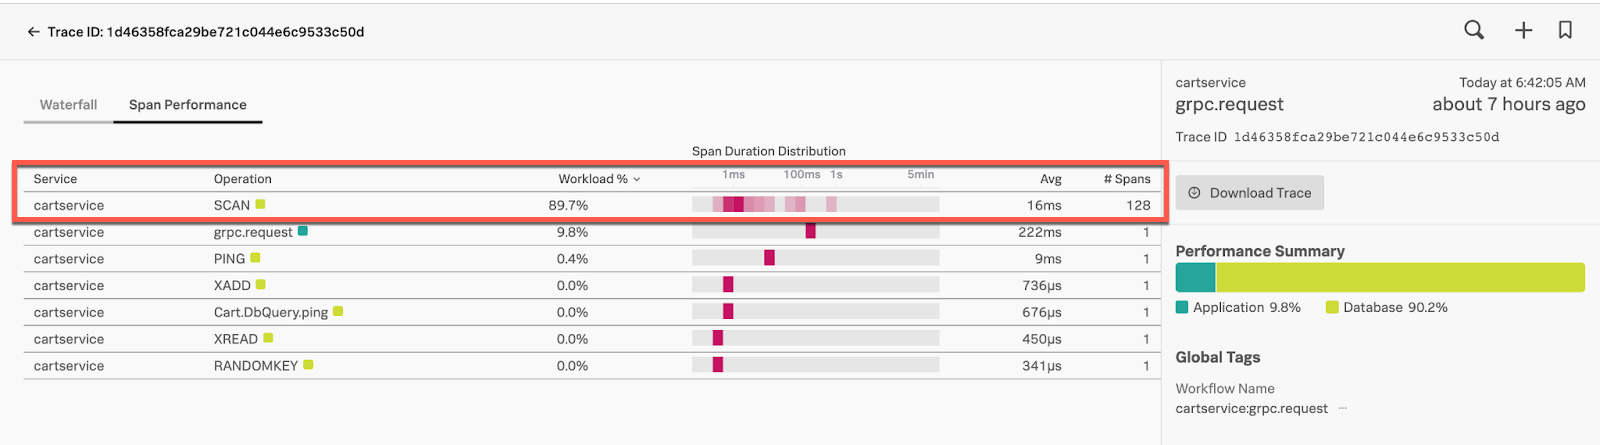
- At this stage you might want to examine if this is impacting the health of the Redis database instance. From Span Performance, click the Trace ID breadcrumb to go back to Tag Spotlight:

- Click on the related content tab at the bottom of Tag Spotlight labeled Redis Host(s) for redis:
- Here you can see that CPU Utilization has increased, Operations/sec has increased and Network bytes/sec has increased. You can conclude that the SCAN is impacting the database instance resource consumption and potentially its performance:
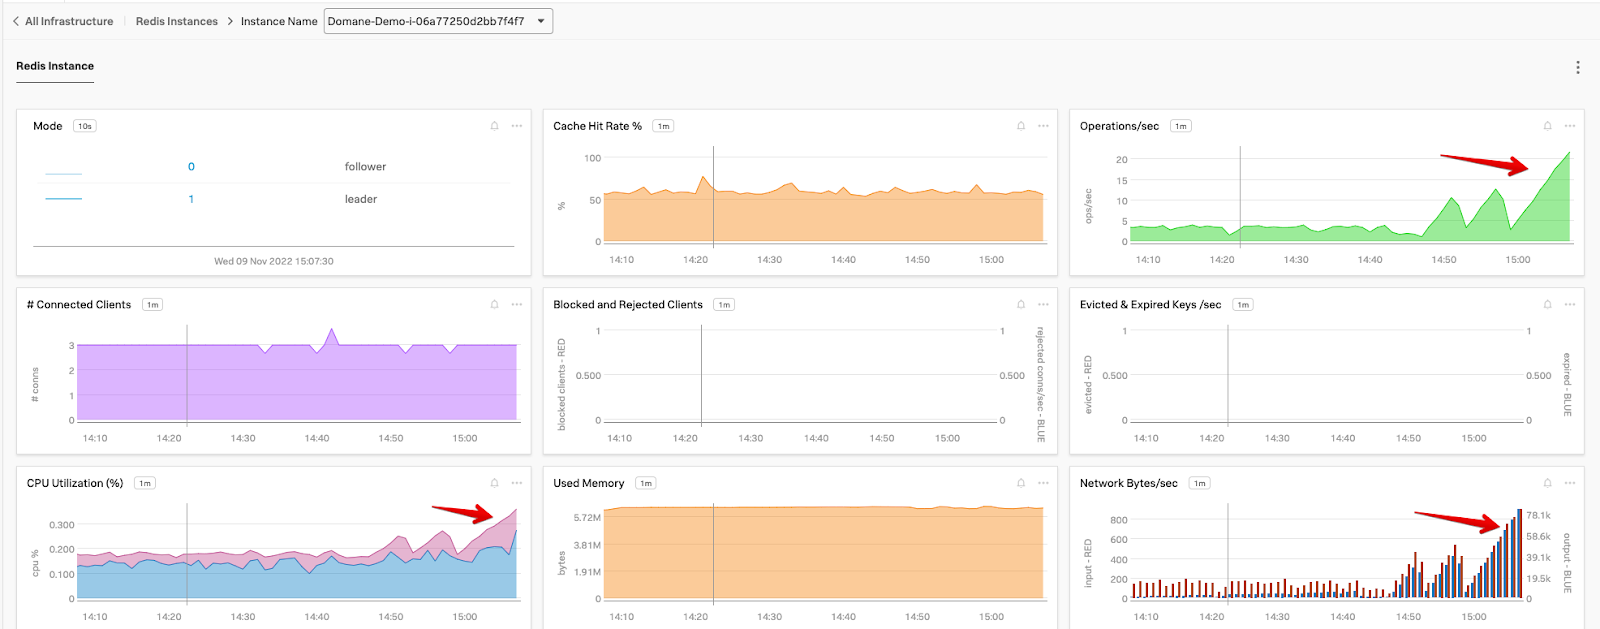
- At this point, you can notify the
cartservicedevelopment team so they can they perform the rollback of thecartserviceservice version. The team can then identify what led up to this problem - for example, whether the SCAN was introduced for testing and should not have been part of the new build. In an instance like this the team can remove the SCAN and redeploy, allowing the database instance metrics to trend back to normal.
Quick identification of the root cause of the latency issue in this instance helps accelerate MTTI (Mean Time to Identify) and MTTR (Mean Time to Recover), with minimal customer impact.
Next steps
You might also be interested in Troubleshooting database performance.
To fully unlock the power of Splunk, we strongly recommend our comprehensive Splunk training. At this stage in your journey, we recommend you explore the Splunk Observability Training Courses.