Monitoring KPIs relating to the app start experience
You work as part of a team that is committed to measuring and optimizing key Service Level Indicators (SLIs) within mobile apps for a range of customers.
When your customers are using your mobile apps, even the slightest delay in the app startup has a negative impact on their MTTA (mean time to acknowledgement) and MTTR (mean time to resolution). It's possible for organizations to lose up to ~$100 each additional second that it takes to acknowledge, triage and resolve production incidents using web and mobile apps.
Since a fast app start experience is such a critical part of our user experience, you can monitor and measure key checkpoints and scenarios using Splunk Real User Monitoring for iOS and Android. You can use three measurements or Service Level Indicators (SLIs) to determine how good or bad the app start experience is in production:
- App Startup Time
- Time to Ready
- Login Failures
How to use Splunk software for this use case
You can use the benchmarks recommended by Android Vitals, and extend the same to iOS. These startup times measure the time it takes for the first frames to appear on the screen from when the app is launched. You can then use Splunk Real User Monitoring auto-instrumentation to measure cold, warm and hot startup times in your apps.

While app start as reported by the operating system (OS) is important, from a user-perception point-of-view, the app hasn’t fully started until they see their data loaded in it. It takes additional time for the app to be fully interactive or ready for the user.
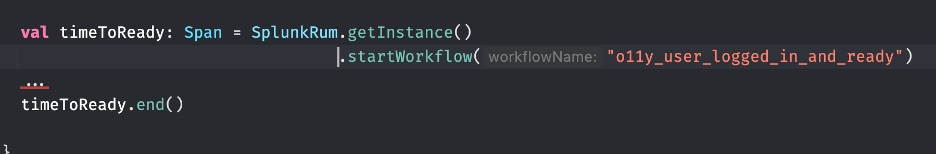
To measure your apps’ Time to Ready, you can add custom events and spans using Splunk Real User Monitoring to capture the true time it takes for the app to be fully interactive and usable for the end user. In this example, in the actual code, this event is called o11y_user_logged_in_and_ready.
Android:
iOS:

You can use OpenTelemetry Tracing APIs available in the Splunk open-source distribution of iOS and Android to account for complex application logic in multiple user paths, and arrive at a single metric for Time to Ready. You can also observe key checkpoints as part of the Time to Ready sequence to quickly identify what bottlenecks there are and continuously optimize the startup process.
Multiple user paths, one metric
P1 or Path 1 (most common app user path): An existing app user has their authentication token securely cached in a keystore. When the app opens, the Time to Ready (or o11y_user_logged_in_and_ready) custom event is started and the following steps are captured as spans:
a. When the app successfully authenticates, the o11y_socket_connection_attempt span is captured, completing the first checkpoint.
b. Next, the app requests data on the user’s account, their alerts, dashboards, and other application data which is sent back in multiple response messages and subsequently processed. This is captured in the o11y_fetch_and_store_dashboards span in {[rum}}.
c. In parallel, the app applies its logic to route the user to the right screen and start rendering as data streams in. When the screen is loaded, stop and capture the Time to Ready custom event.

P2 or Path 2 (infrequent app user path; <10% of the time): If an app user with cached credentials attempts to authenticate and fails due to an invalid token or expired token, the app routes the user to the login screen and stops to report the Time To Ready (or o11y_user_logged_in_and_ready) custom event. In addition, the app stops the other spans, such as o11y_socket_connection_attempt. The same principle is applied when a new user enters invalid credentials in the login flow.

Login failures
The inability to login when you’re in a hurry leads to user frustration and potentially app abandonment. Splunk Real User Monitoring captures status codes and messages for each state of the following cases:
- 403: Incorrect username and password
- 503: Backend not accepting authentication requests
- 302: Misconfigured Single Sign On (SSO)
You should monitor the rate of 503s especially as part of your SLIs, and work with your backend teams to take immediate action anytime it spikes.
Next steps
The content in this article comes from a previously published blog, one of the thousands of Splunk resources available to help users succeed. In addition, these resources might help you understand and implement this guidance: