Gaining better visibility into ServiceNow instances in ITSI
Your organization uses ServiceNow extensively. Different areas of your organization have different requirements for insights and information relating to ServiceNow, for example:
- IT Operations need visibility into the state of events, incidents, and change requests to ensure services are delivered to all customers without interruption.
- CIOs / CTOs need to ensure full visibility and awareness of key systems and applications. They need to ensure business leaders are able to operate the business without interruption or incident.
- Business leaders need visibility of known events, incidents, and change requests to operate the business effectively and serve customers with speed and efficiency.
- Support analysts need immediate insights into the state of events, incidents, and change requests. They must enable their group to best serve stakeholders quickly and with accurate information on critical services and systems.
- DevOps / SREs need correlation and telemetry across observability and other data sets (including events, incidents, and change requests) to deliver services without interruption to stakeholders.
- DevSecOps needs to provide insights into the lower and production environments and to observe events, incidents, and change request trends and results. They need to increase accountability for security so they can deliver secure services faster with reduced business and customer risk.
Solution
The Splunk Content Pack for ServiceNow brings in key data such as events, change requests, incidents, and business applications from all your ServiceNow instances into Splunk, allowing all of the business areas listed above to make better and quicker informed decisions. If your organization is using ServiceNow and modernizing IT Operations or moving from another product to Splunk, this content pack is a great fit for you.
The Content Pack provides:
- 1 Technology add-on (TA)
- 4 Glass tables
- 1 Service Analyzer
- 4 Services
- 12 Key Performance Indicators (KPIs)
- 4 Entity types and 15 Vital metrics
- 10 Dashboards
If you are a customer using IT Essentials Work, some of the features in the Splunk Content Pack for ServiceNow will be more limited than the features available for customers using Splunk ITSI.
Installing and configuring the Splunk Content Pack for ServiceNow
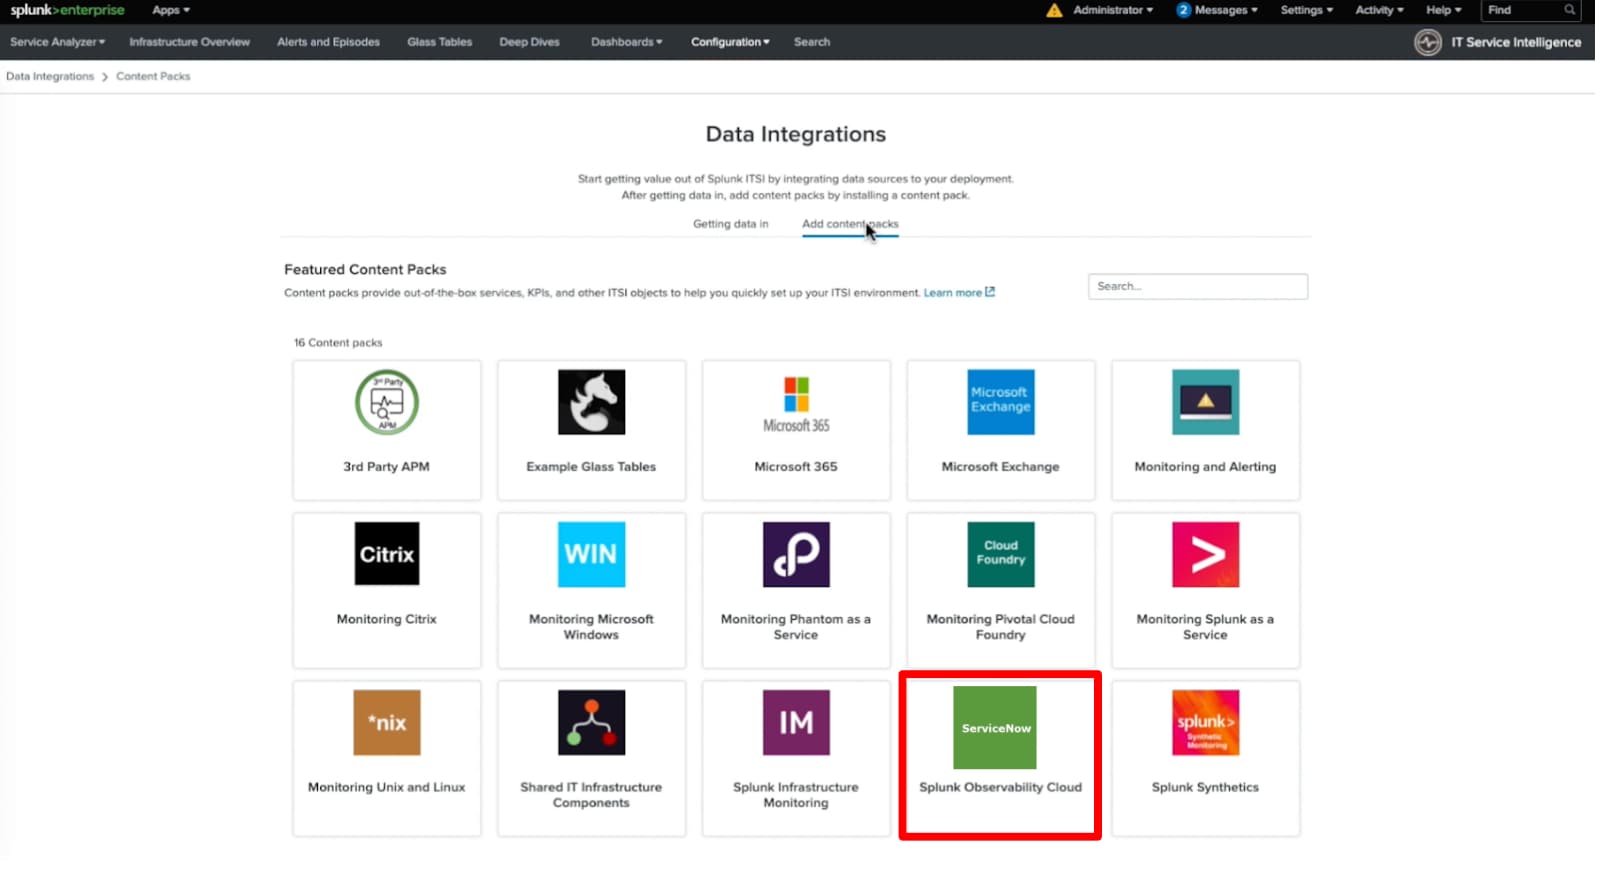
The Splunk Content Pack for ServiceNow is bundled within the Splunk App for Content Packs v1.5.0 and up. You should also install the Dendrogram visualization app.
After you open the Splunk App for Content Packs, click the icon representing this content pack, and within 60 seconds it is installed.
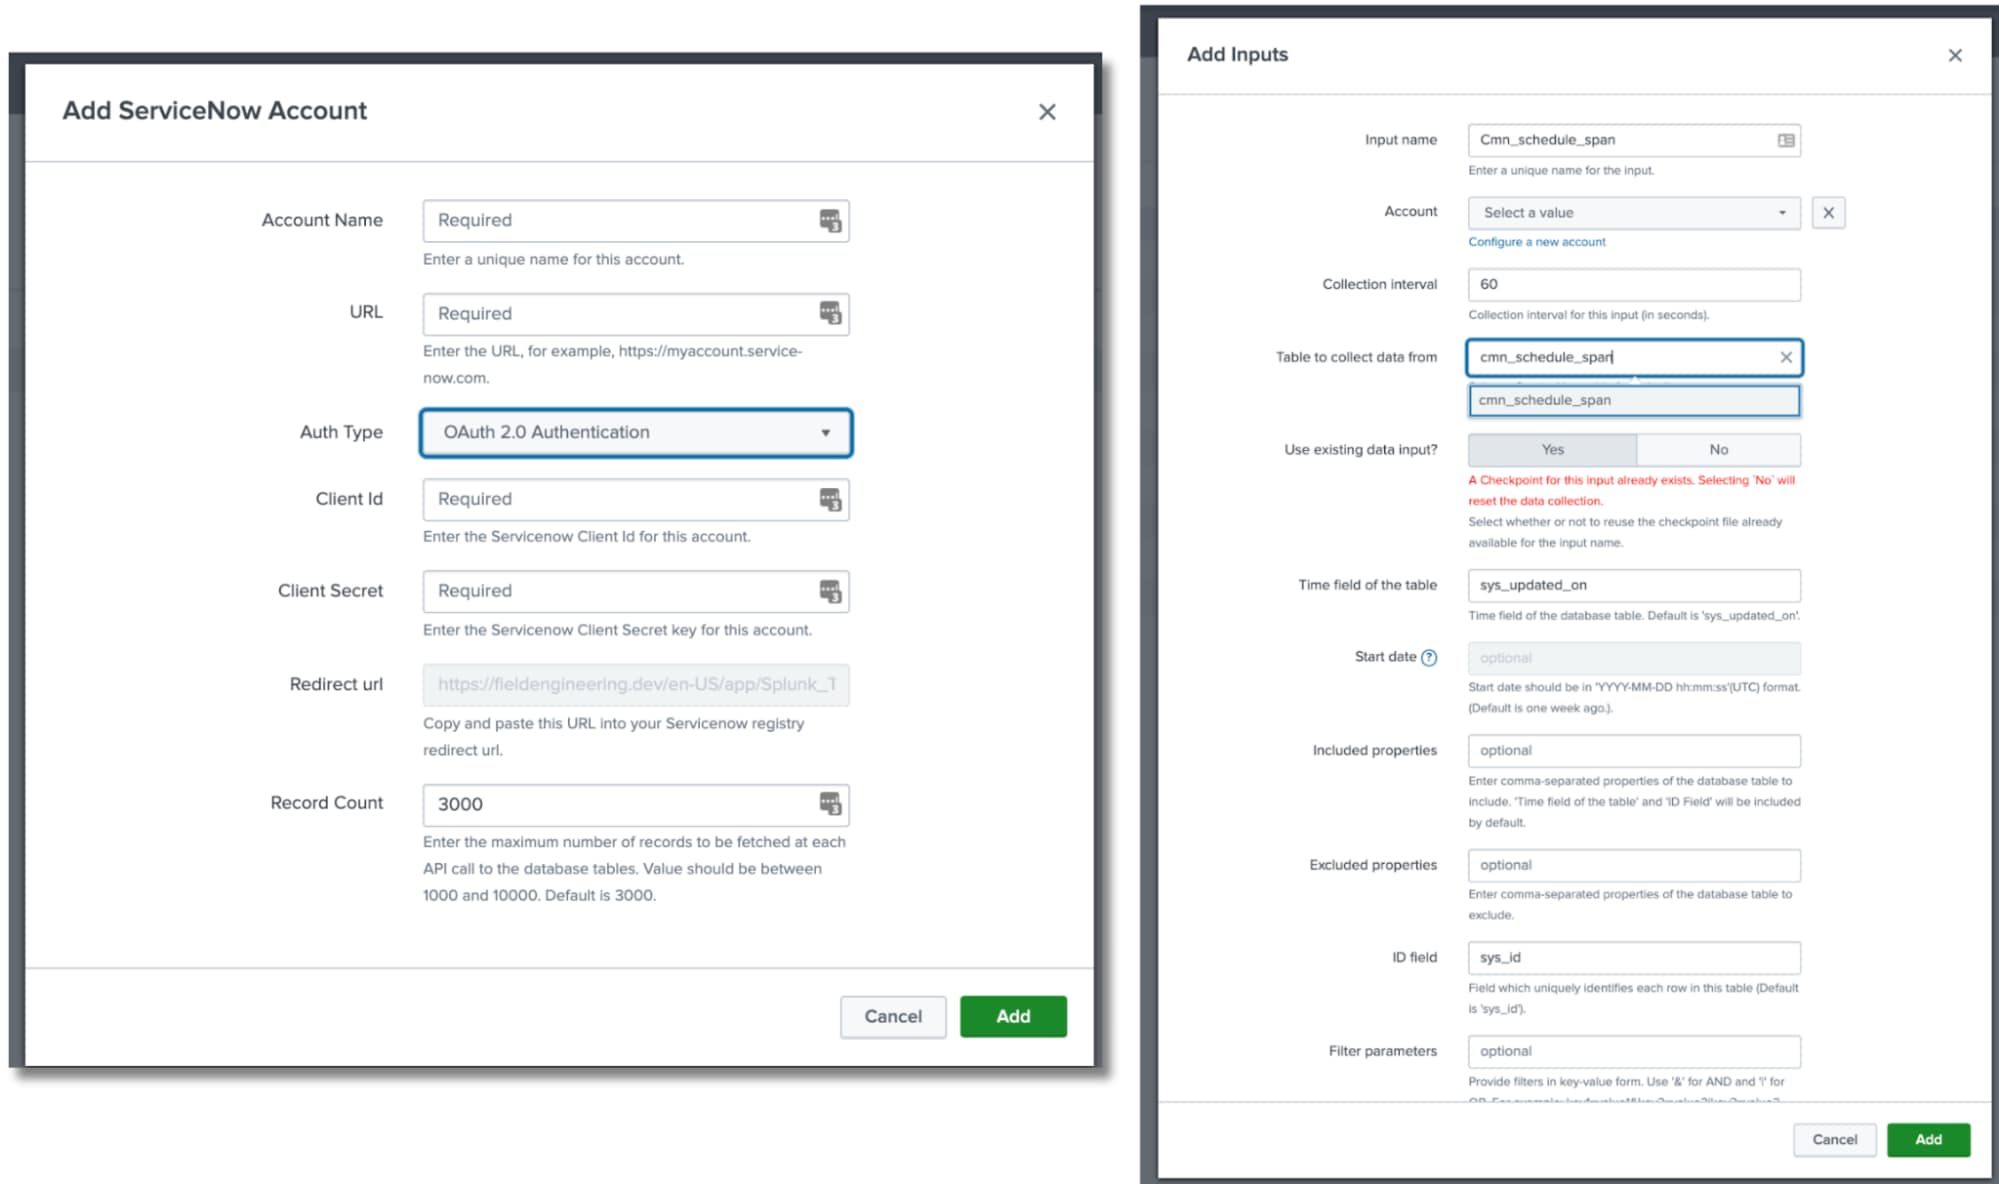
Next, configure the Splunk Add-On for ServiceNow to start bringing data in from your ServiceNow instances. This only takes a few minutes.
Glass tables
You can use the preconfigured glass tables within the Splunk Content Pack for ServiceNow to visualize and monitor the interrelationships and dependencies across your IT and business services. These tables allow you to create dynamic, contextual views of your IT topology or business processes and monitor them in real time. You can add metrics like KPIs, ad hoc searches, and service health scores that update in real time against a background that you design, with real-time data generated by KPIs and services displayed.
The Content Pack includes four preconfigured glass tables that provide insights across your key services, KPIs, and entities:
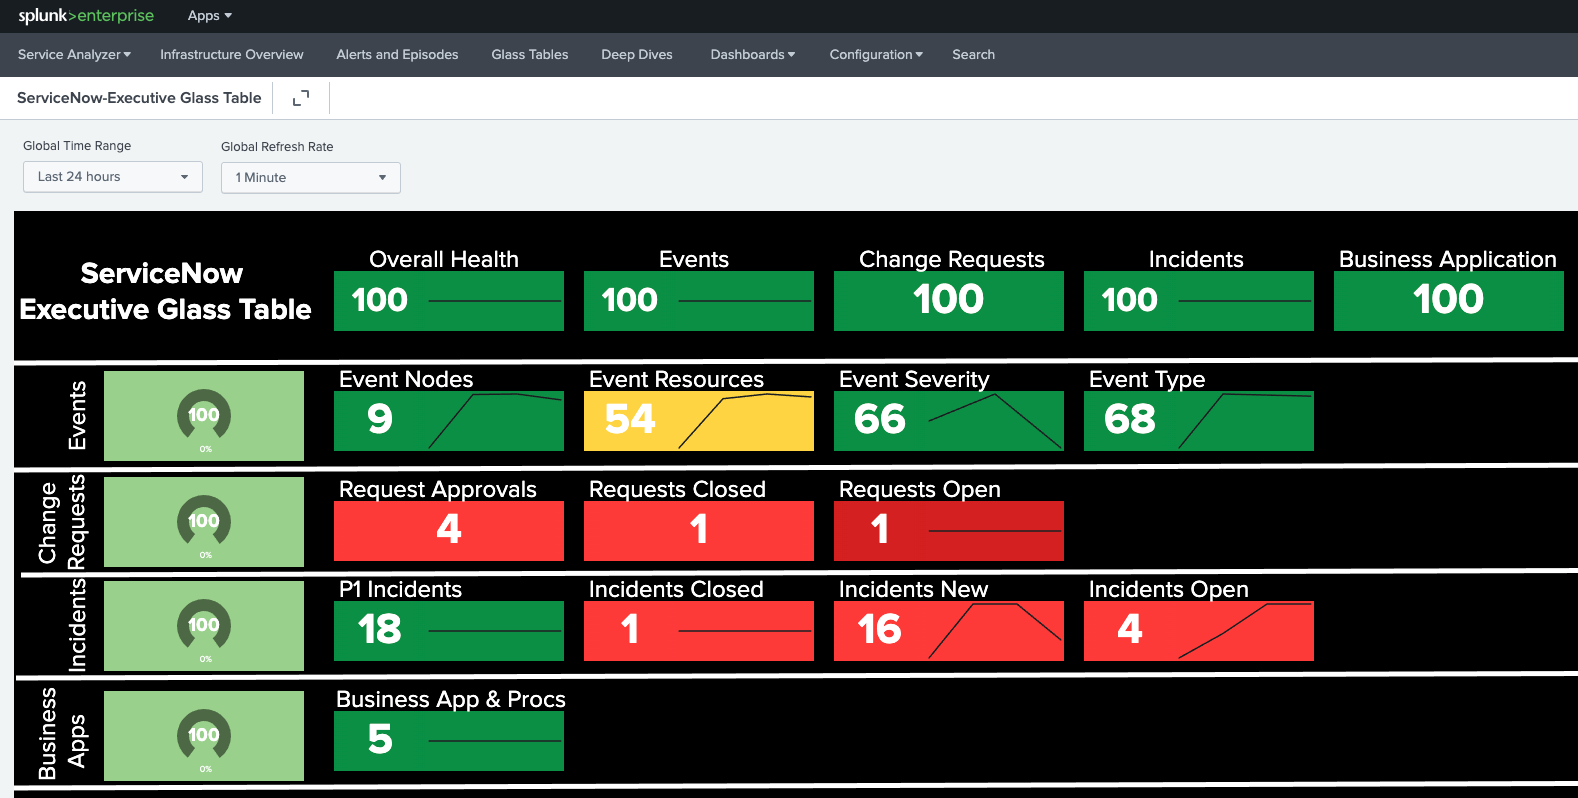
Executive Glass Table
The Executive Glass Table delivers insights across five major areas: overall health, events, change requests, incidents, and business applications. In a single view, you get a quick and real-time update for your ServiceNow instances, as well as single-click access to additional details. In addition to colors that show the current state, you also see trends for each of these major areas.
Project this interactive glass table on on a wall or a third monitor within your NOC or SOC for visibility for your stakeholders.
Events Glass Table
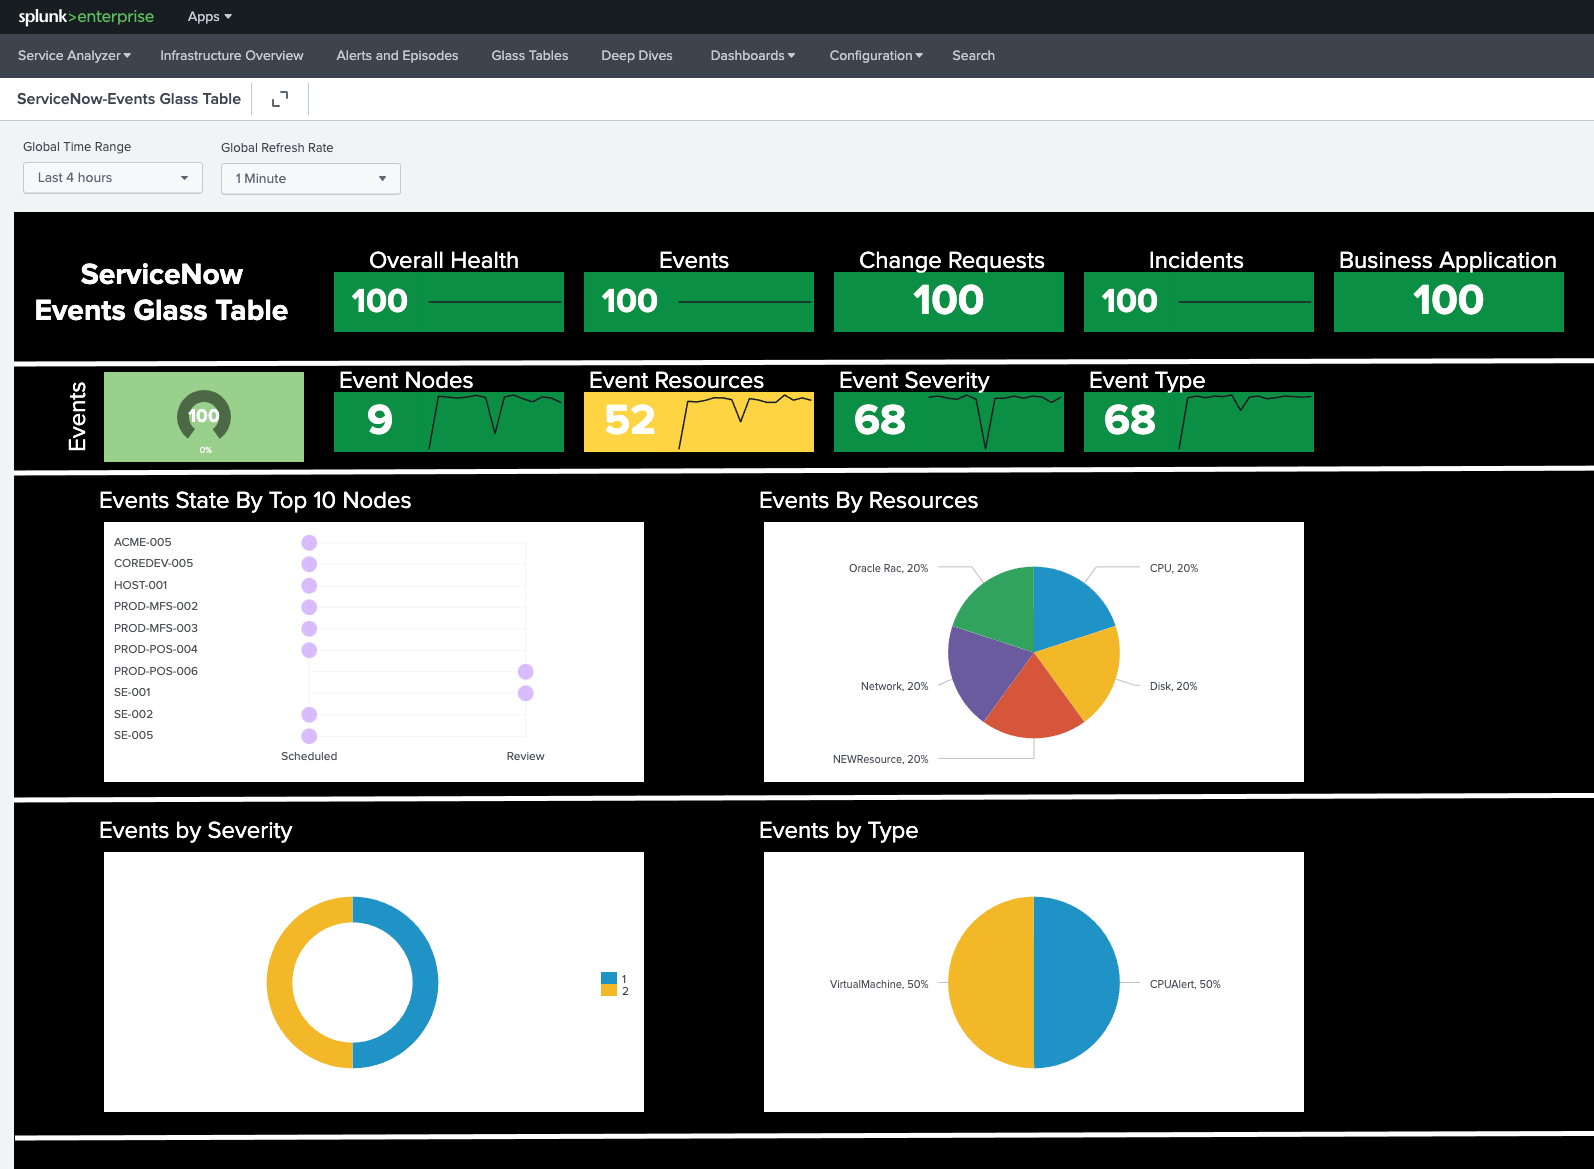
This Events Glass Table provides a top level view across all your ServiceNow instances, specific events information, and a few key charts.
The top level view includes overall health, events, change requests, incidents, and business application. Next level down, you have a quick overview of events: event notes, event resources, event severity, and event type. Lastly, you can find tables for the events state by top 10 nodes, events by resources, events by severity, and events by type.
After you click into the details, you can click into your ServiceNow instance embedded deep link for results in context to get to the specific item of interest very quickly.
Incidents Glass Table
The Incidents Glass Table provides a top level view across all your ServiceNow instances, specific events information, and a few key charts.
The top level view includes overall health, events, change requests, incidents, and business application. On the next level down, you have a quick overview of Incidents: P1 incidents, incidents closed, incidents new, and incidents open. You can also find tables for the incidents bubble chart and incidents (not closed or canceled) by geography.
After you click into the details, you can click into your ServiceNow instance embedded deep link for results in context to get to the specific item of interest very quickly.

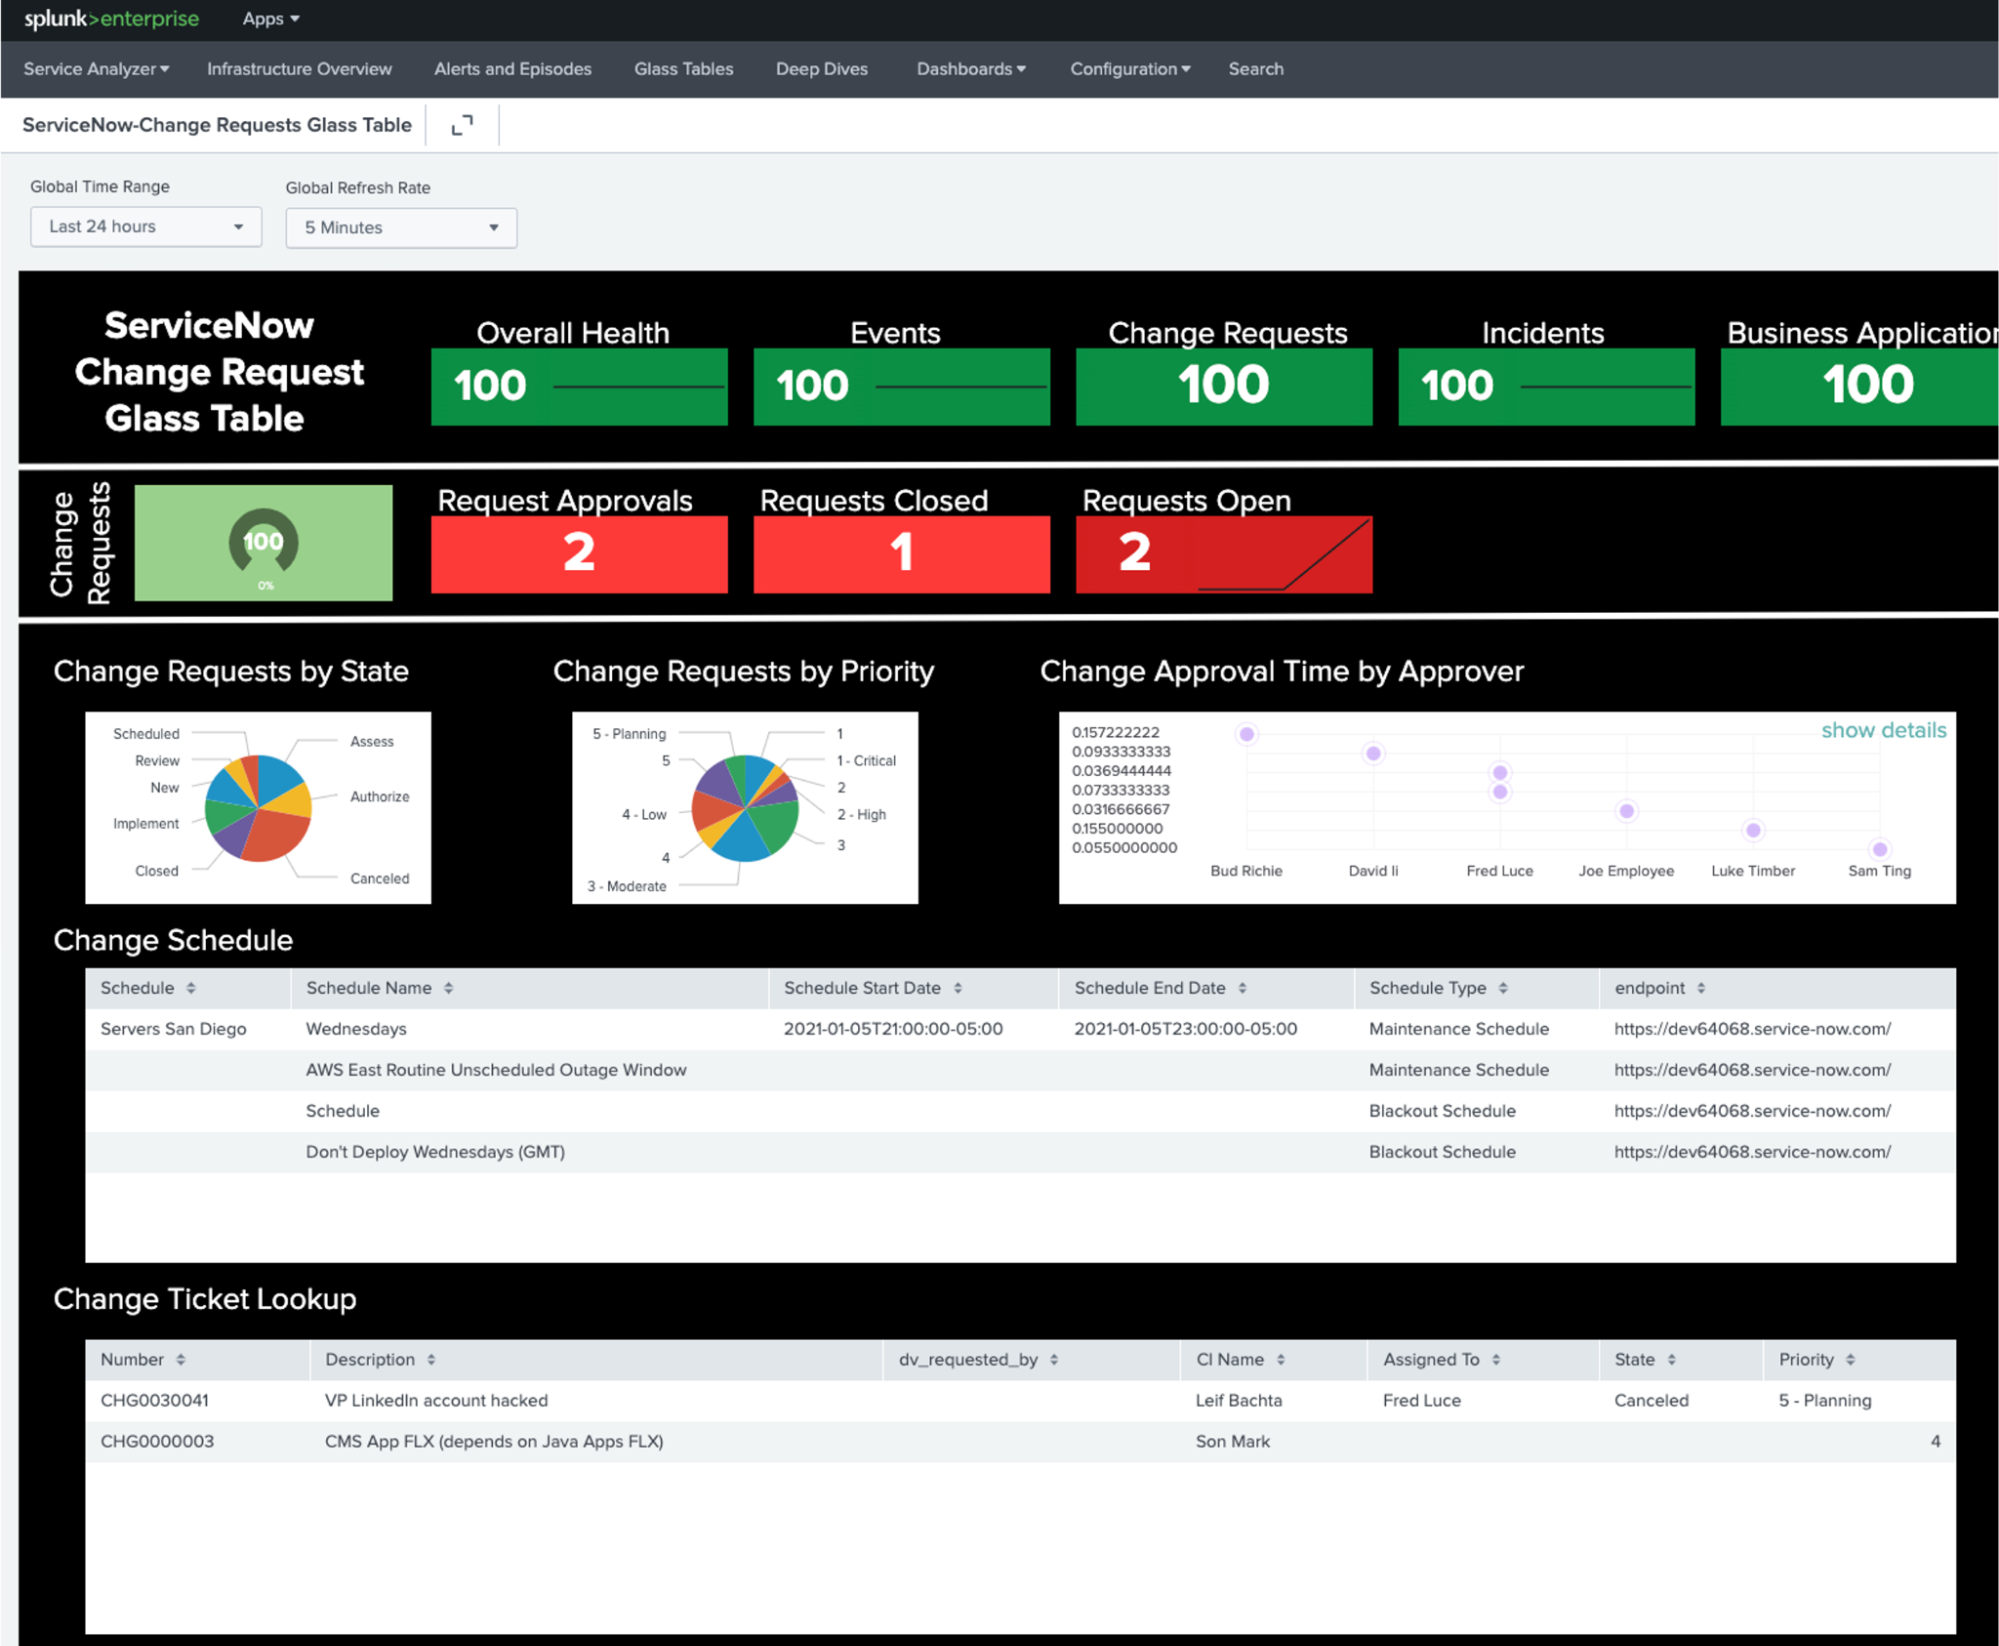
Change Requests Glass Table
The Change Requests Glass Table provides a top level view across all your ServiceNow instances, specific events information, and a few key charts.
The top level view includes overall health, events, change requests, incidents, and business application. On the next level down, you have a quick overview of change requests: request approvals, requests closed, and requests open. Lastly, you can find tables for change requests by state, change requests by priority, change approval time by approver, change schedule, and change ticket lookup.
After you click into the details, you can click into your ServiceNow instance embedded deep link for results in context to get to the specific item of interest very quickly.
Service Analyzer
The Service Analyzer is the home page for Splunk ITSI and serves as your starting point for monitoring your IT operations. It enables you to see the live health of your IT environment at a glance.
The Service Analyzer provides an overview of ITSI service health scores and KPI search results that are trending at the highest severity levels. You can use the Service Analyzer to quickly view the status of IT operations and to identify services and KPIs running outside expected norms. Click on any tile in the Service Analyzer to drill down for further analysis and comparison of search results over time.
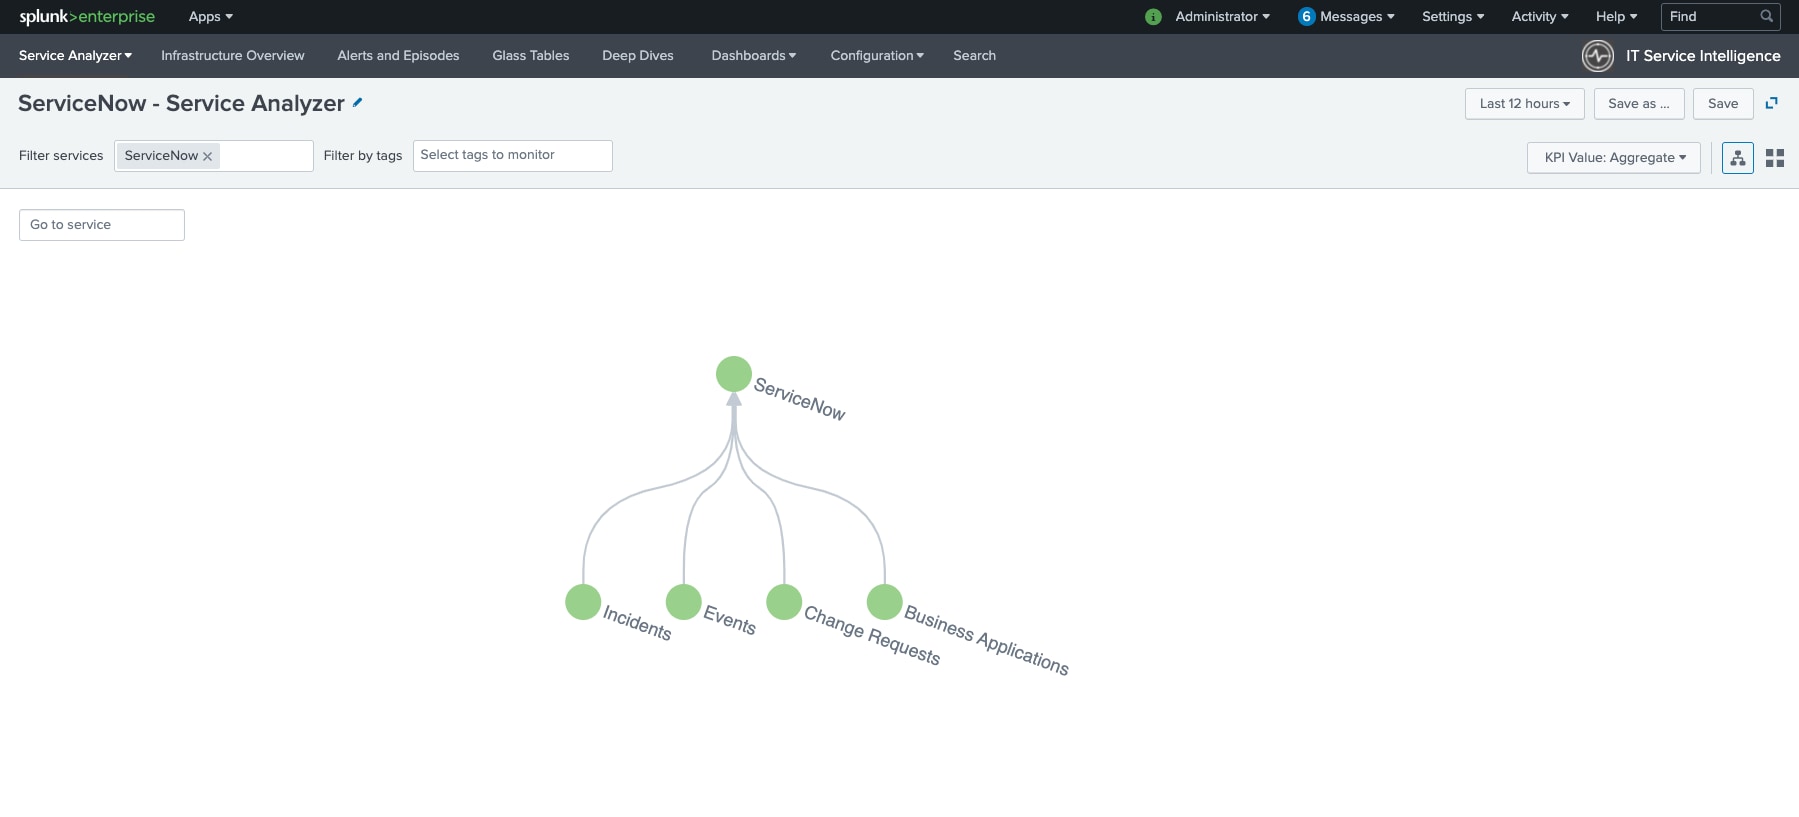
There are two Service Analyzer views: the tile view and the tree view. You can drill down to more detailed information from each view to investigate services with poor health scores.
In the example Service Analyzer below, the tree view shows each of the four services and the status of how the underlying KPIs are reporting.
Services
A service is a logical mapping of IT objects that applies to your business goals. The definition of a service is fairly broad. You can create business and technical services that model those within your environment, with some services that might have dependencies on other services. Services contain KPIs which make it possible to monitor service health, perform root cause analysis, receive alerts, and ensure that your IT operations are in compliance with business service-level agreements (SLAs).
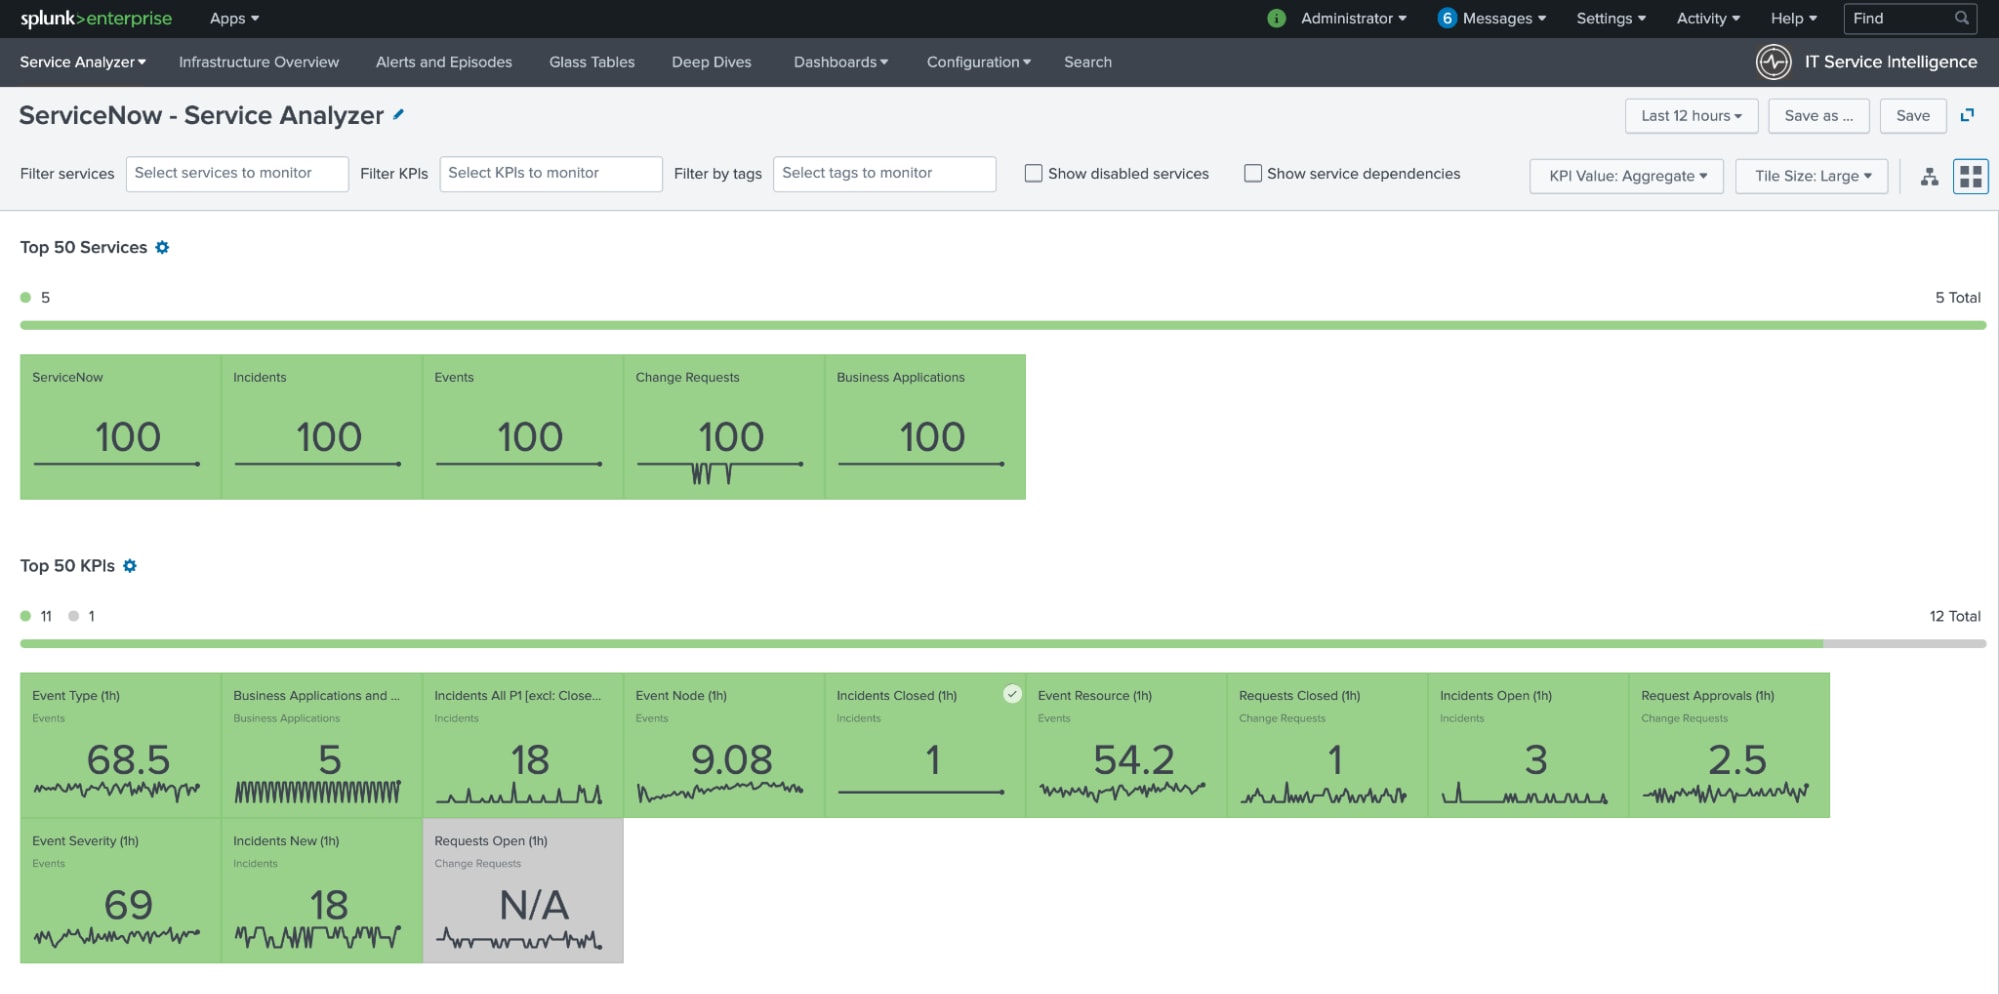
In the example below, you can see the tile view of the Service Analyzer. This provides you with insights across all 25+ services and their status for the time range selected. You can also click into more results for any of these services to see the KPIs, entities, and more.
KPIs
A Key Performance Indicator (KPI) is a recurring saved search that returns the value of an IT performance metric, for example CPU load percentage, memory used percentage, or response time. A KPI is used to monitor the health of a service.
You create KPIs within a specific service. The KPI allows you to generate searches to help you understand the underlying data, including how to access, aggregate, and qualify with thresholds. You can use the search results to monitor service health, check the status of IT components, and troubleshoot trends that might indicate an issue with your IT systems.
The Splunk Content Pack for ServiceNow includes 12 KPIs. You can check the Splunk Docs page KPI reference for the Content Pack for ServiceNow for more information on these KPIs.
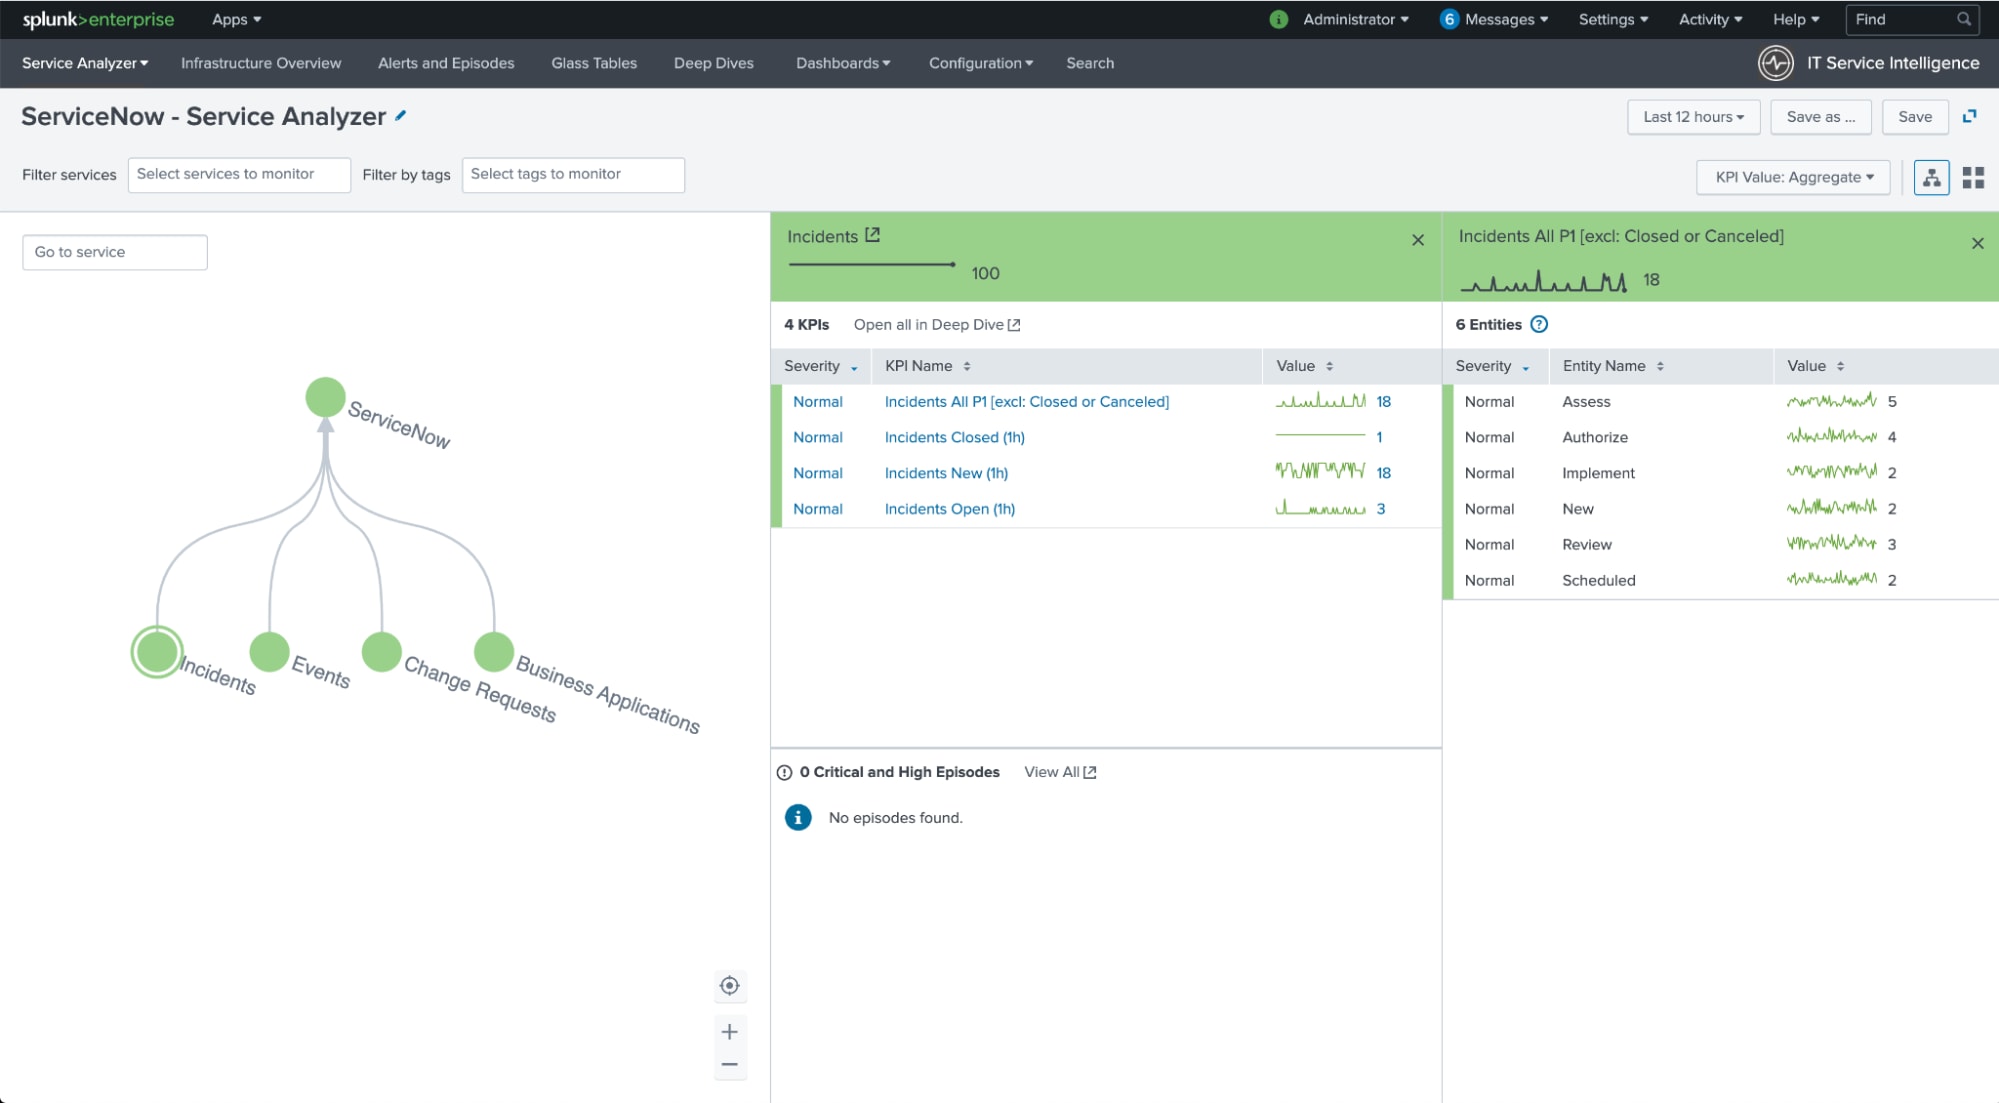
In the example shown below, access to the results are available in one click. You can also quickly see the underlying entities and how each is reporting.
Entity types and vital metrics
The Splunk Content Pack for ServiceNow includes four custom entity types:
- CMDB
- Change Requests
- Event
- Incident
You can use associations to visualize and troubleshoot various entities.
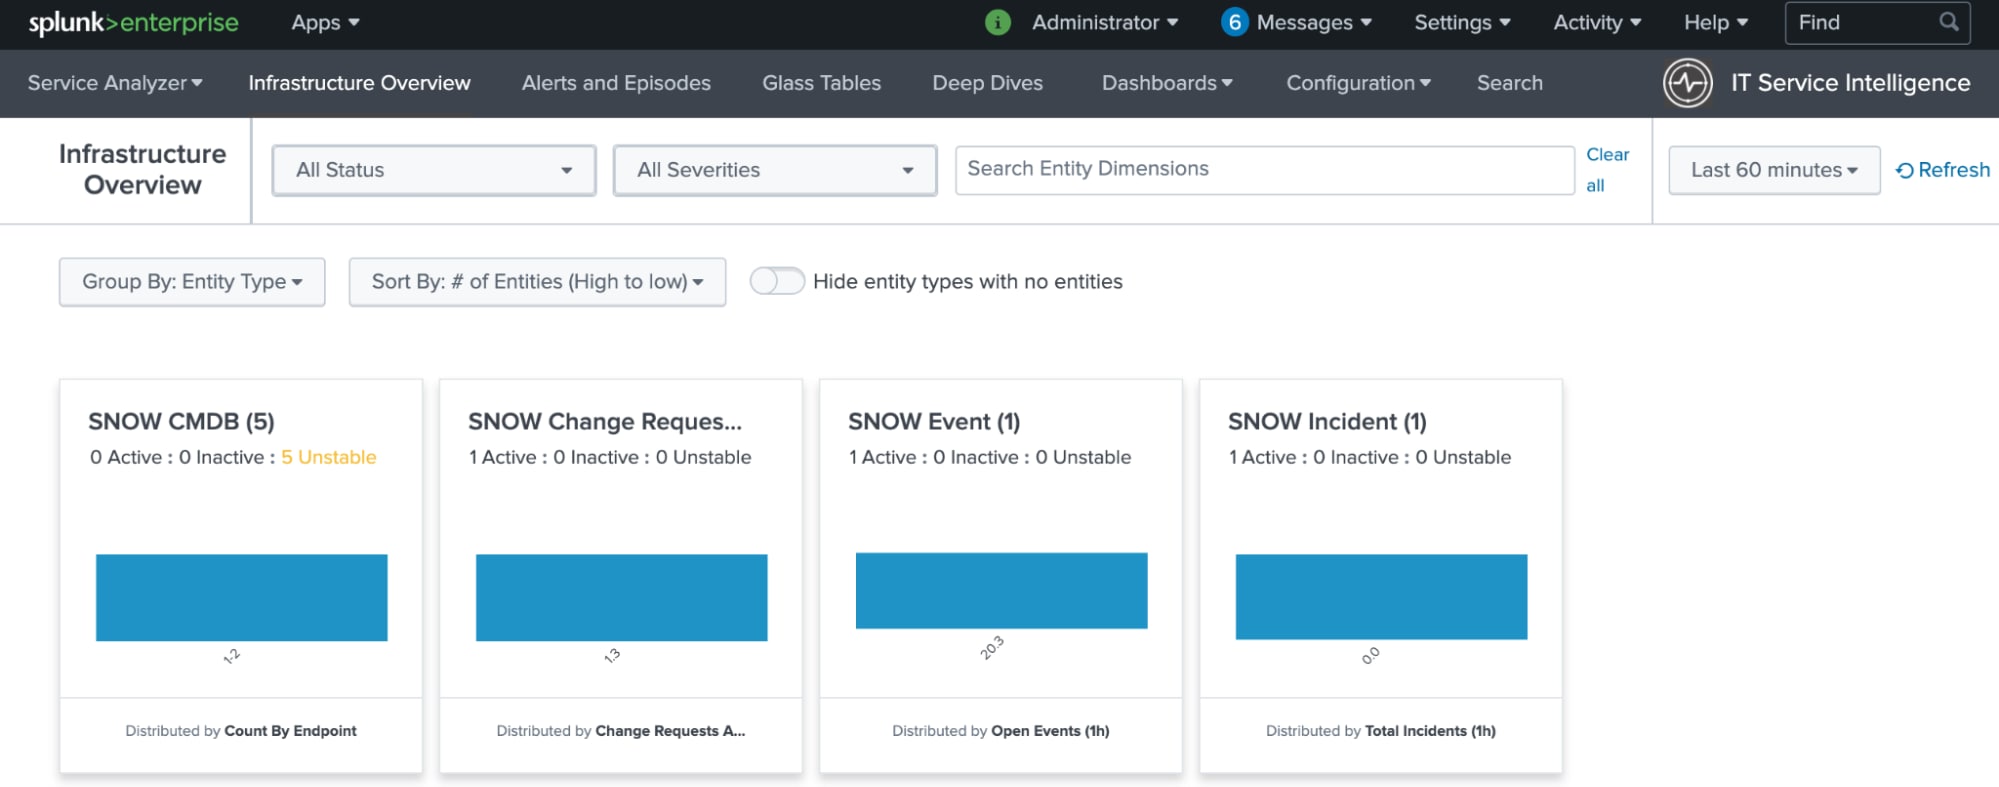
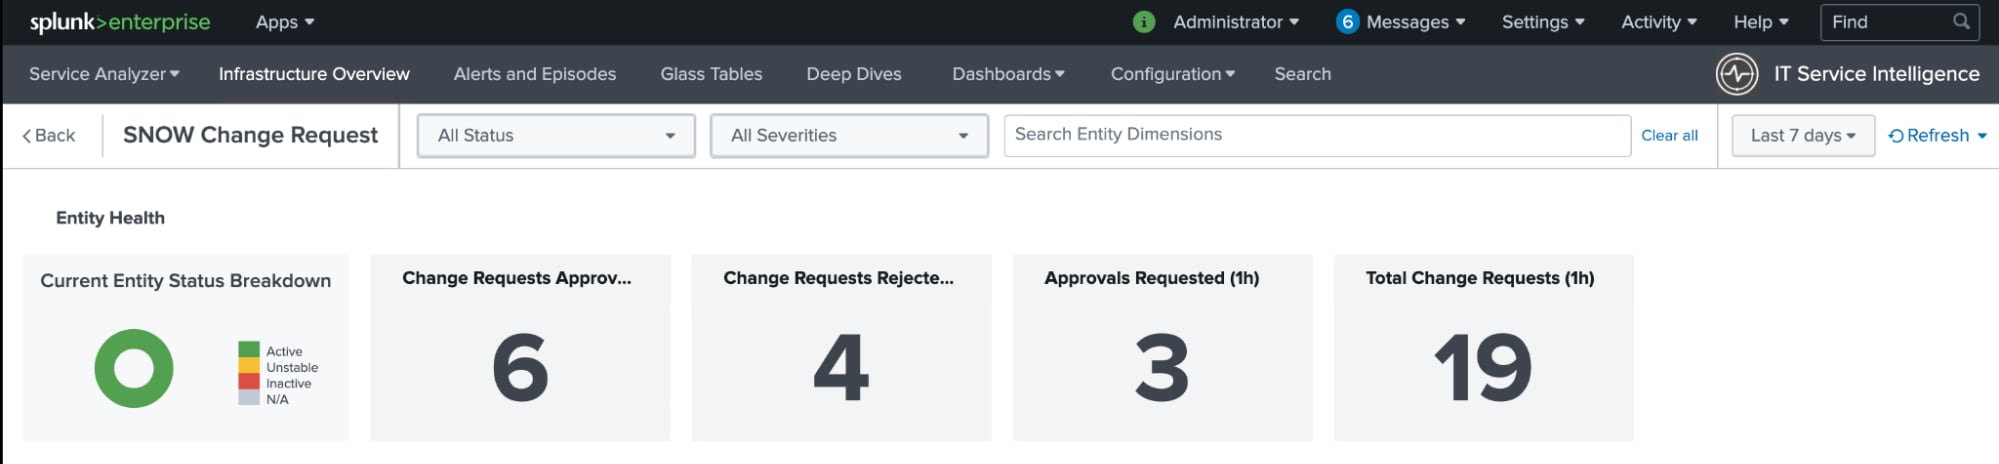
In the Splunk Content Pack for ServiceNow, you also receive 15 vital metrics out-of-the-box which describe the overall health of entities. You can view these metrics on the Entity Health page and drill down further into individual entities.
You can add, modify, or delete the preconfigured entity types. For instructions to create and edit entity types, see Create custom entity types in ITSI.
Dashboards
Dashboards are used to display tables or charts in panels which hold the summarized data in a visually appealing manner. You can add multiple panels and multiple reports and charts to the same dashboard.
In the Splunk Content Pack for ServiceNow, there are 10 different dashboards:
- Overview
- Auto-Created Incidents
- Change Performance
- Change Tasks
- CMDB
- CMDB Overview
- Events
- Incident Performance
- Incidents Inspector
- Open Incidents by Geography
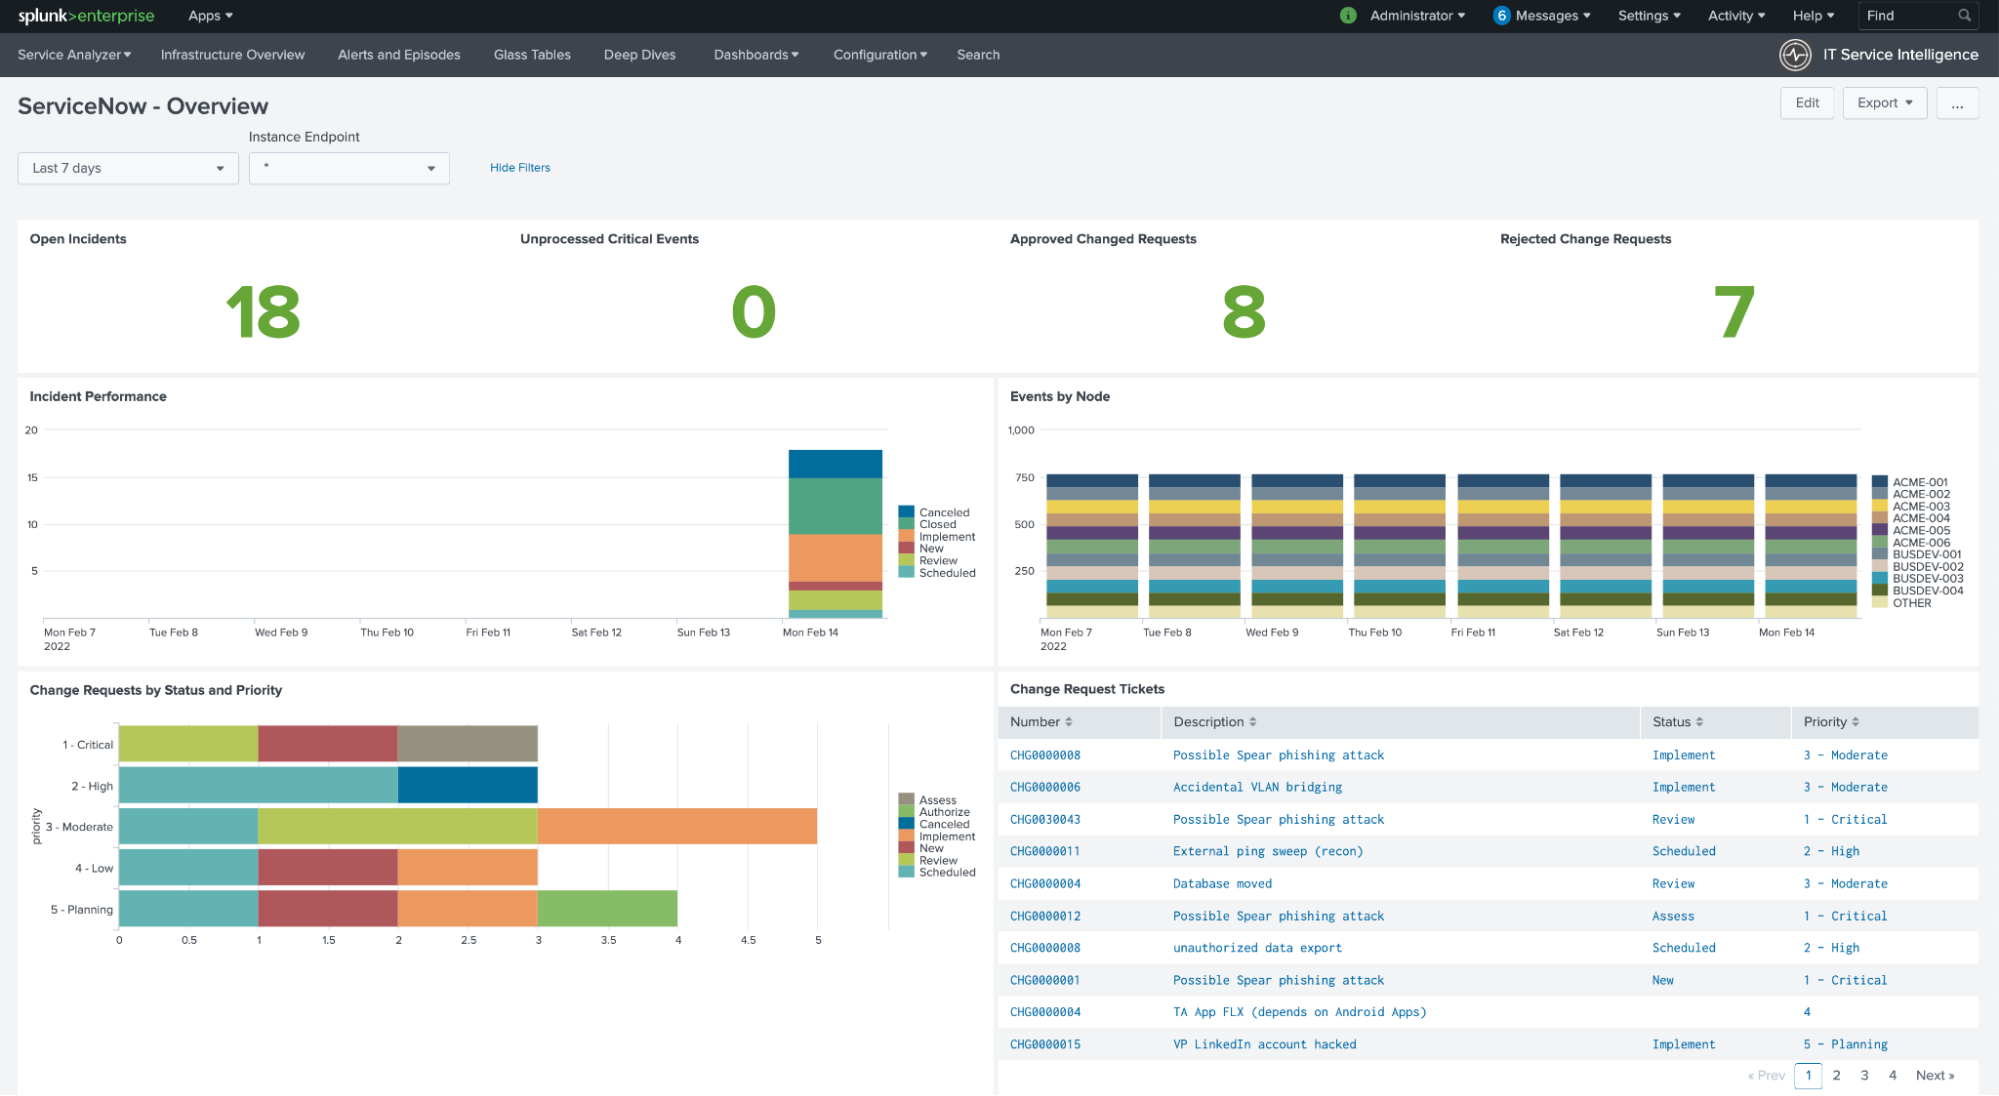
The example below shows the Overview dashboard, which provides you with insights from across all your ServiceNow instances.
Additional resources
The content in this use case comes from a previously published blog, one of the thousands of Splunk resources available to help users succeed. These additional Splunk resources might help you understand and implement these recommendations: