Identifying DNS reliability and latency issues
As a Site Reliability Engineer (SRE), you need a way to quickly identify Kubernetes network issues before application developers spend time determining if application degradation is related to development issues in their microservices.
DNS can be difficult to debug and can often cause impactful outages with many downstream issues. DNS unreliability leads to service outages, which can cause problems for SREs when managing Kubernetes clusters at scale.
Data required
How to use Splunk software for this use case
Within Splunk Infrastructure Monitoring, Network Explorer is a network observability capability designed for cloud and microservice environments.
Network Explorer can gather DNS metrics on a per-service basis, so service owners can determine if their service made a DNS request and received errors. With Network Explorer you can ingest and analyze network telemetry, which you can use to:
- Identify network anomalies in real time
- Discover sources of high network cost in your environment
- Examine service topology with visualizations
After an application issue has been reported, you can use Splunk Infrastructure Monitoring and Network Explorer to determine if network connections are causing issues. The following steps will help with your investigation.
- Refer to the instructions to Set up Network Explorer in Kubernetes if you have not already set it up.
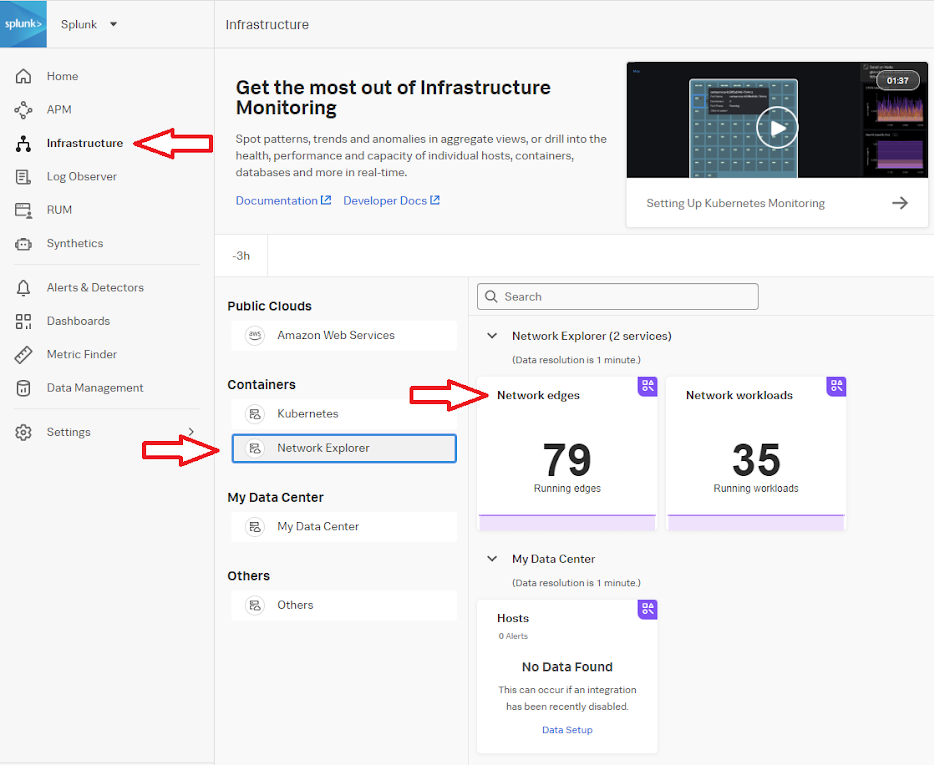
- In Splunk Observability Cloud, click Infrastructure > Network Explorer > Network edges to view network connections between Kubernetes workloads.
-
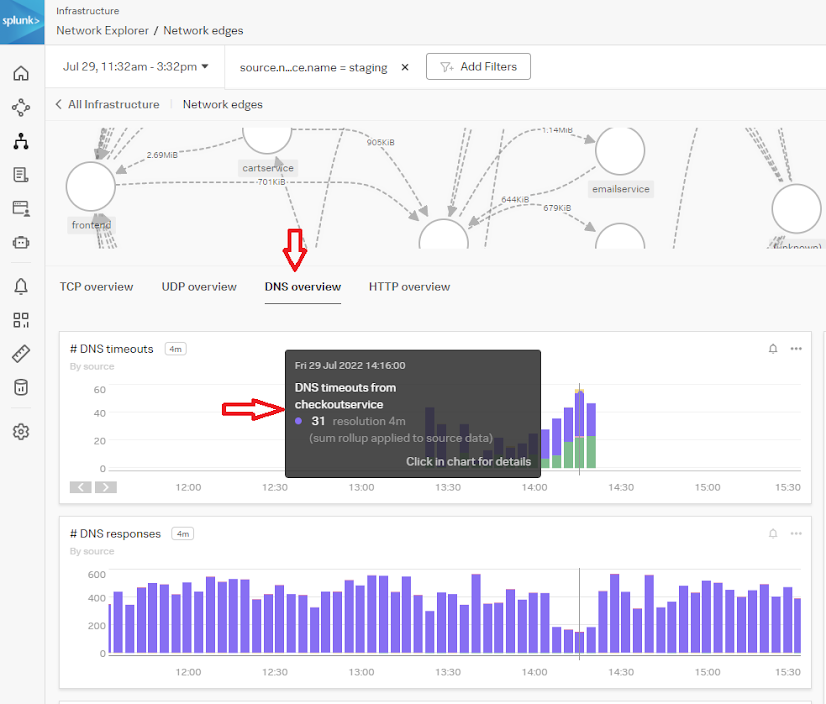
The Network Map opens. Use this to identify network interactions between services, specifically the checkout and payment services, which is where the application degradation was reported.
.png?revision=1)
Network Explorer provides an out-of-the-box map of your Kubernetes environment, which is helpful when troubleshooting service interactions for potential network issues. No additional configuration is required for this map view, which can be used after the OTEL helm chart has been deployed.
- Click the DNS overview tab to view DNS timeouts, responses, and latency. In the example below, there is a timeout specific to the checkoutservice during the timeframe of the reported issues.
- You can also see there was a spike in latency during this time, which is a good indicator that DNS is causing downstream issues with the application's performance.
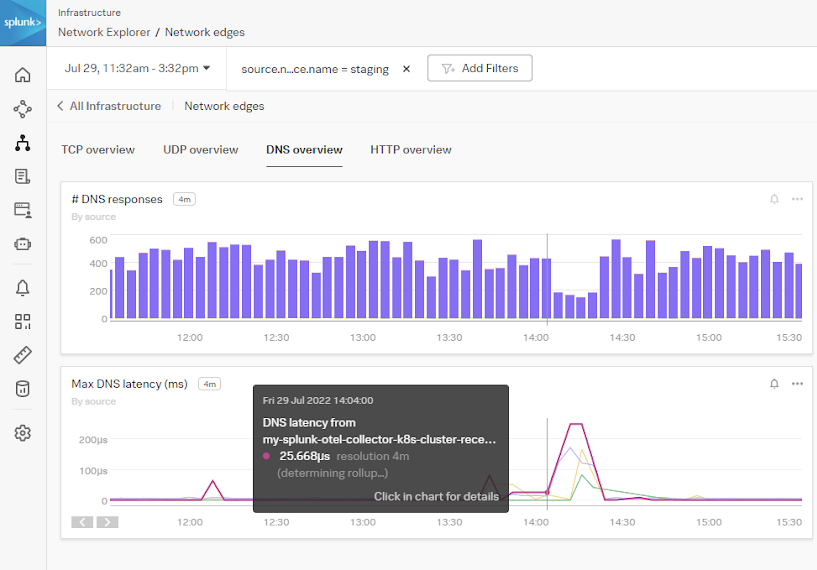
You can conclude that the reported issue was caused by a network issue and not the application itself. The service owners can continue with day-to-day activities without needing to invest time in troubleshooting the reported issue.
Next steps
These resources might help you understand and implement this guidance:
- Splunk Docs: Set up Network Explorer in Kubernetes