Monitoring AWS Fargate deployments powered by Graviton2 processors
Your organization has a number of microservices running as containers in multiple AWS ECS Fargate clusters. With Amazon Elastic Container Service (ECS) Fargate, you can easily deploy, manage, and scale these applications without having to choose EC2 server types, decide when to scale clusters, or optimize cluster packing. However, you are still facing challenges. Your DevOps and IT teams can visualize the CPU and memory utilization for each cluster and service but they are unable to deeply analyze the tasks, containers, and resource utilization along with the dependencies. They cannot troubleshoot task crashes that lead to pressure on their back office jobs as well as real-time impact to customers.
Data required
AWS ECS Fargate data
How to use Splunk software for this use case
With Splunk Observability Cloud and AWS ECS Fargate with Graviton2
- Developers and cluster administrators can easily track each cluster, service level resource utilization, identify the root cause for task crashes, create alerts, and respond in real time to prevent a bad customer experience.
- Cloud workloads running on Fargate powered by AWS Graviton2 processors achieve performance with lower costs than comparable Intel x86-based Fargate.
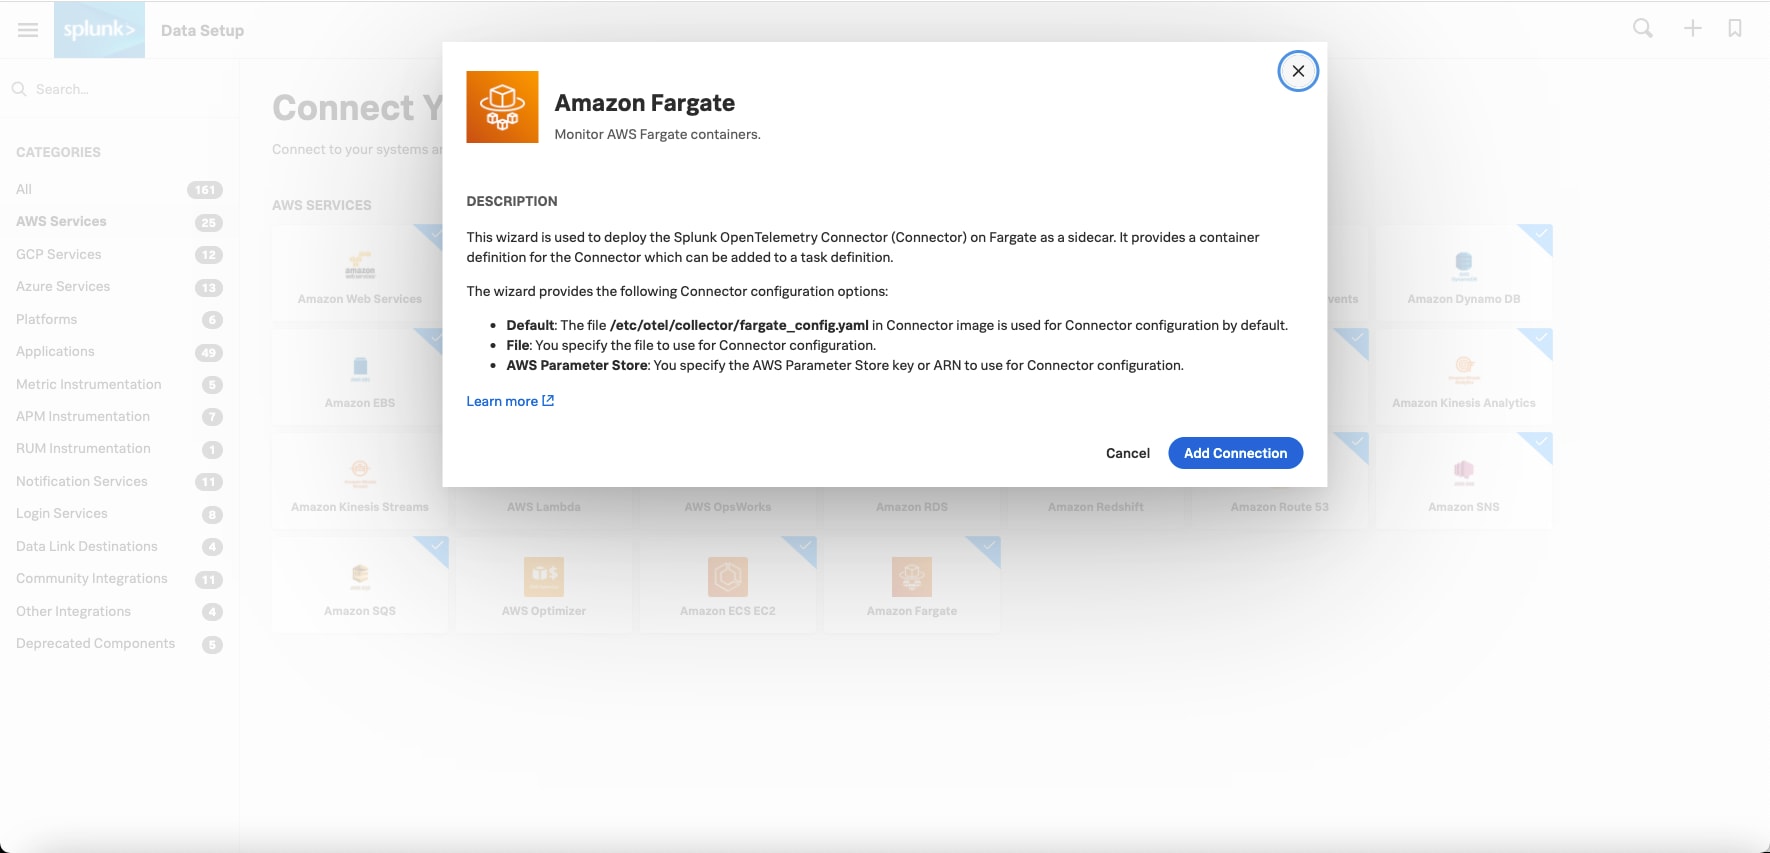
To begin collecting telemetry from the ECS Fargate cluster, you can deploy the Splunk OpenTelemetry Collector as an additional container to ECS tasks. OpenTelemetry is a collection of tools, APIs, and SDKs used to instrument, generate, collect, and export telemetry data (metrics, logs, and traces) to help you analyze your application’s performance and behavior. The Splunk OpenTelemetry Collector is the distribution of the upstream OpenTelemetry Collector that provides a unified way to collect, process and export metric, log, and tracing data to the Splunk Observability Cloud backend.
To get started, follow these steps:
- Navigate to the Splunk Observability Cloud suite UI.
- Click Data Setup on the left navigation bar.
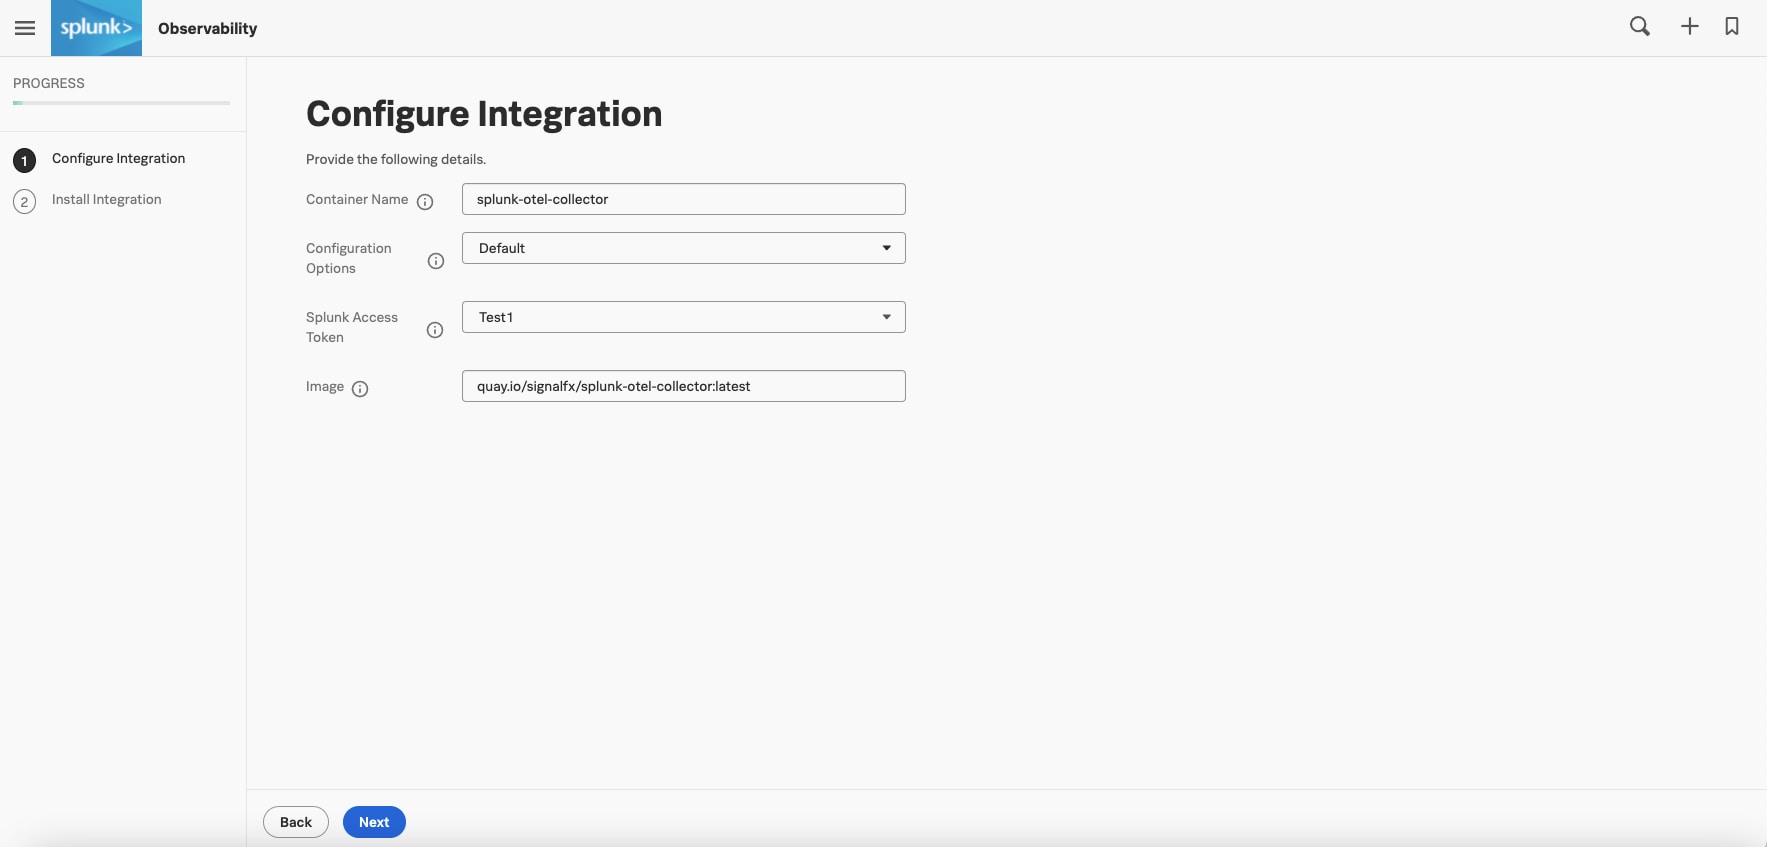
- On the Data Setup page, click the Amazon Fargate tile and follow the instructions to configure the integration. Specify the parameters:
- The correct access token.
- The quay URL that points to the multi-architecture Splunk OpenTelemetry Collector Docker image that has ARM64 in the image manifest, along with AMD64.
- Add the generated container definition snippet to your task definition in the AWS ECS console.
- To verify the task is running with the Graviton-based compute, look for the Linux/ARM64 for Operating system/Architecture in each task detail page of the ECS console.
- Users can then navigate to the Infrastructure tab to see a heatmap of all the clusters in the ECS navigator, as well as details like:
- Top clusters and services by CPU% and Memory%
- Number of clusters and tasks
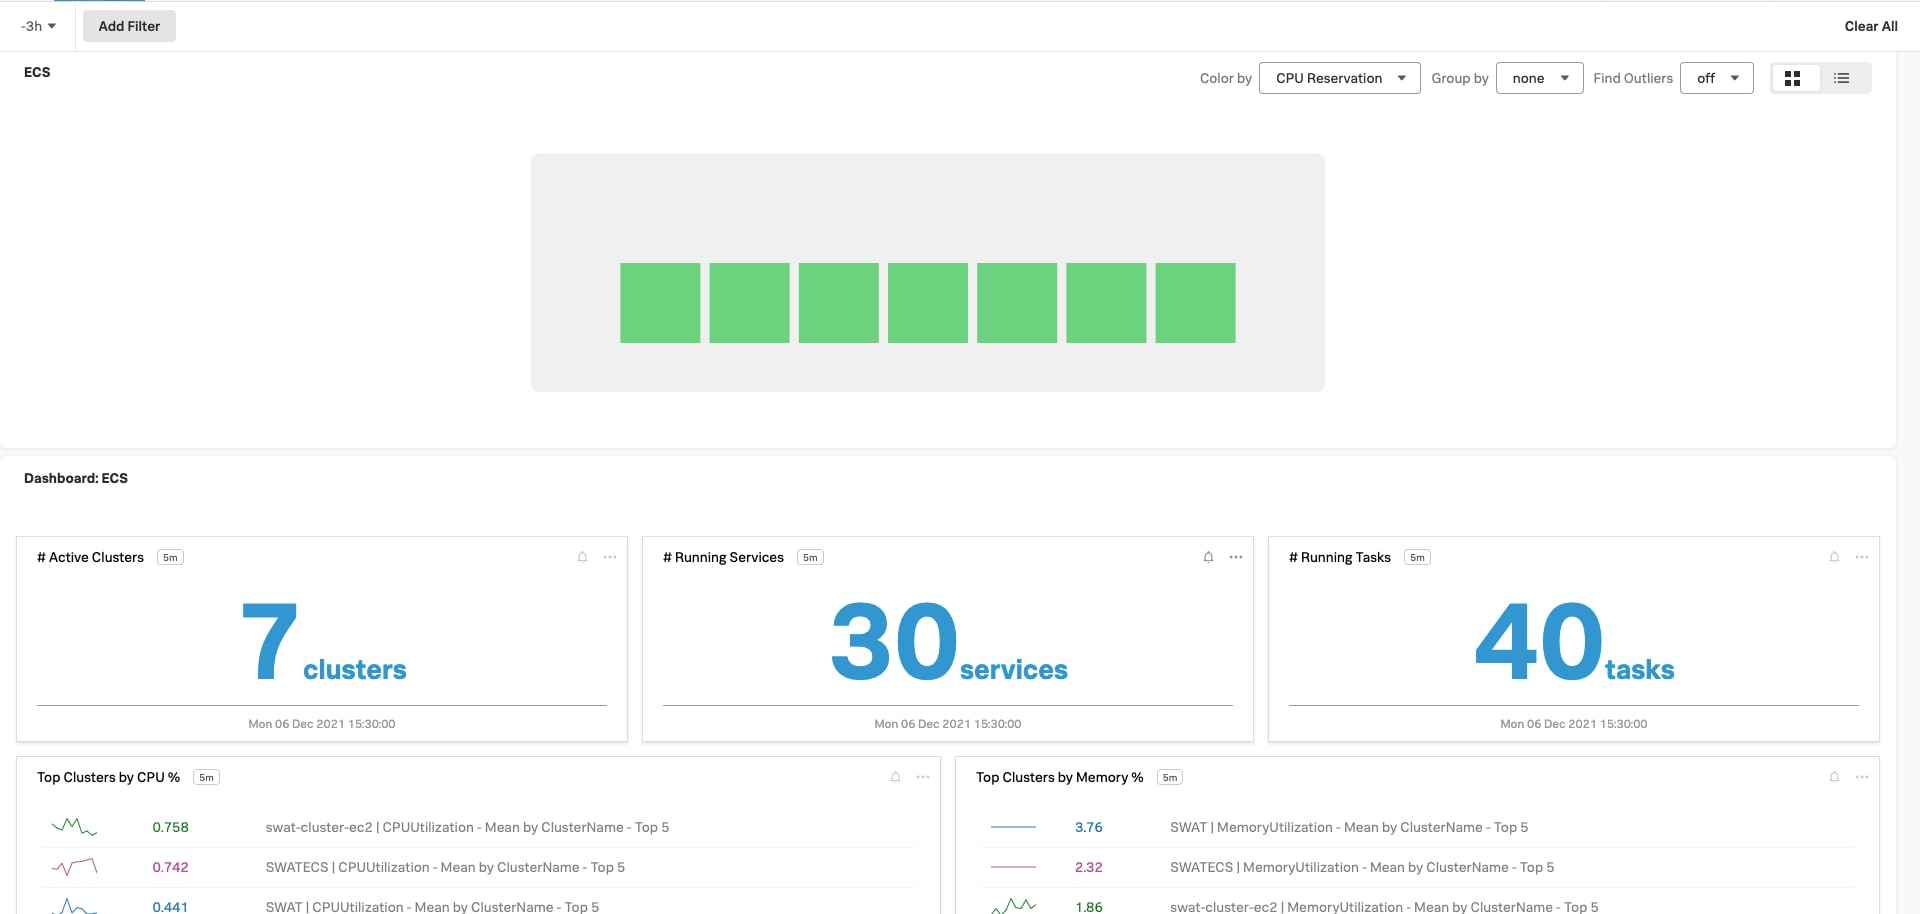
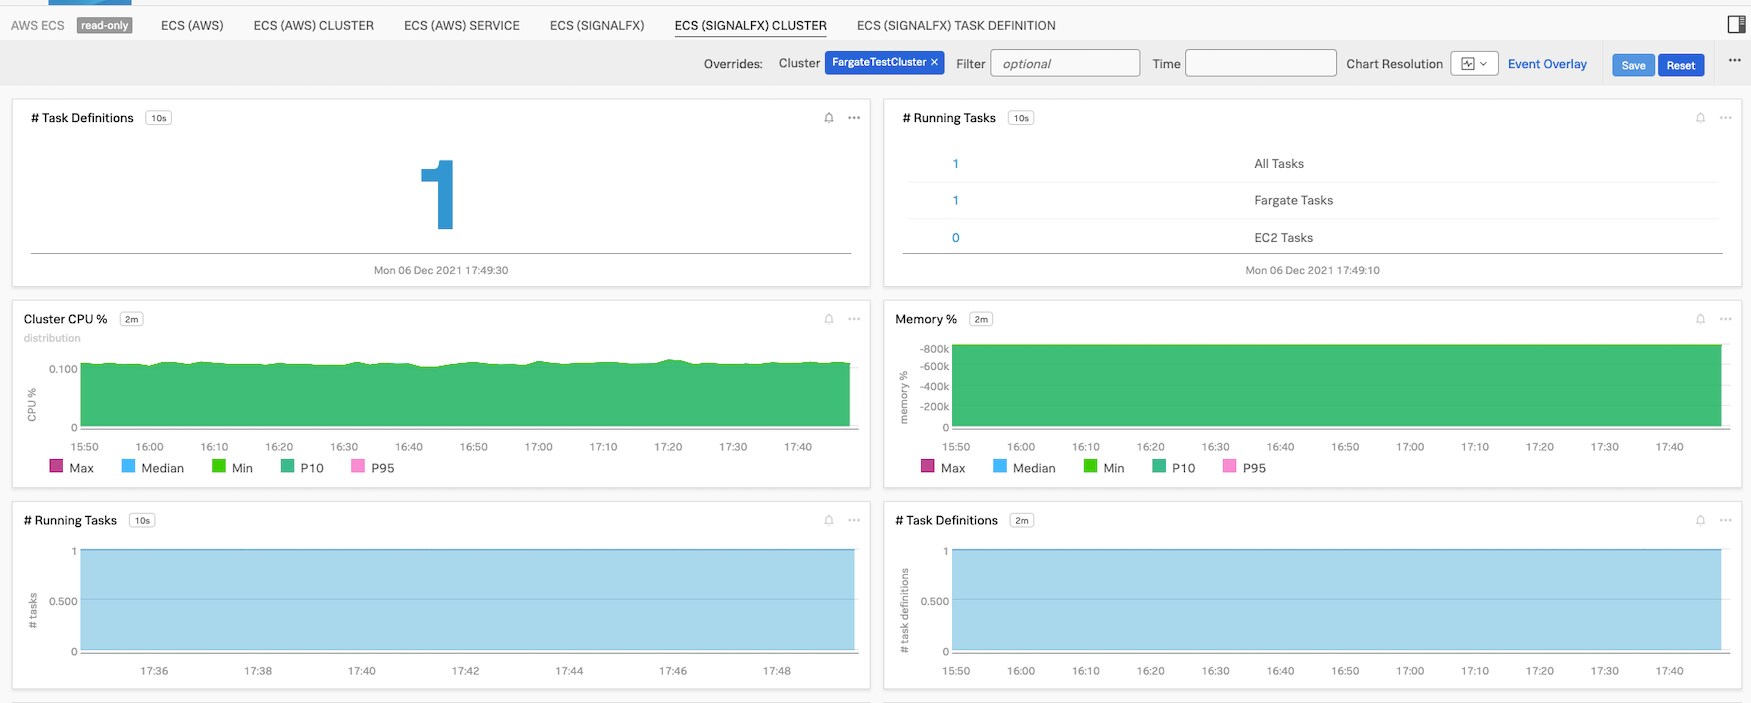
Users can also see resource utilization, container health, and counts with out-of-the-box (OOTB) dashboards for ECS, as well as visibility into metrics filtered on a cluster level.
Next steps
The content in this guide comes from a previously published blog, one of the thousands of Splunk resources available to help users succeed. In addition, these Splunk resources might help you understand and implement this use case: