Reducing time-to-resolution with interactive runbooks
All on-call engineers at your organization have access to runbooks that they use to debug and remediate problems. However, those runbooks have some problems:
- They are wikis that don't always get updated when links to dashboards and other essential troubleshooting materials change.
- They aren't written by professional tech writers and can be hard to follow, with large blocks of text and no numbered steps to create a clear workflow.
- They often give too many options - multiple causes for a problem with multiple remediations. For engineers who aren't familiar with all system components, these choices can be overwhelming and lead to long times to resolution.
As a service owner, bad runbooks can cause pages to escalate to you even when you aren't on call. Improving your runbooks will make it less likely you'll get woken in the middle of the night and reduce your organization's mean-time-to-resolution.
How to use Splunk software for this use case
You create interactive runbooks in Splunk Observability Cloud dashboards. By creating text panels in your dashboards that provide the runbook steps and combining those with charts that show live, real-time information about the system, you can increase on-call engineer efficiency and lower everyone's stress level.
All essential information about creating dashboards can be found in Splunk Docs, Dashboard types in Splunk Observability Cloud, so in this article, we'll look at some best practices for building interactive runbooks. We'll use an example six-step interactive runbook for dropped datapoints.
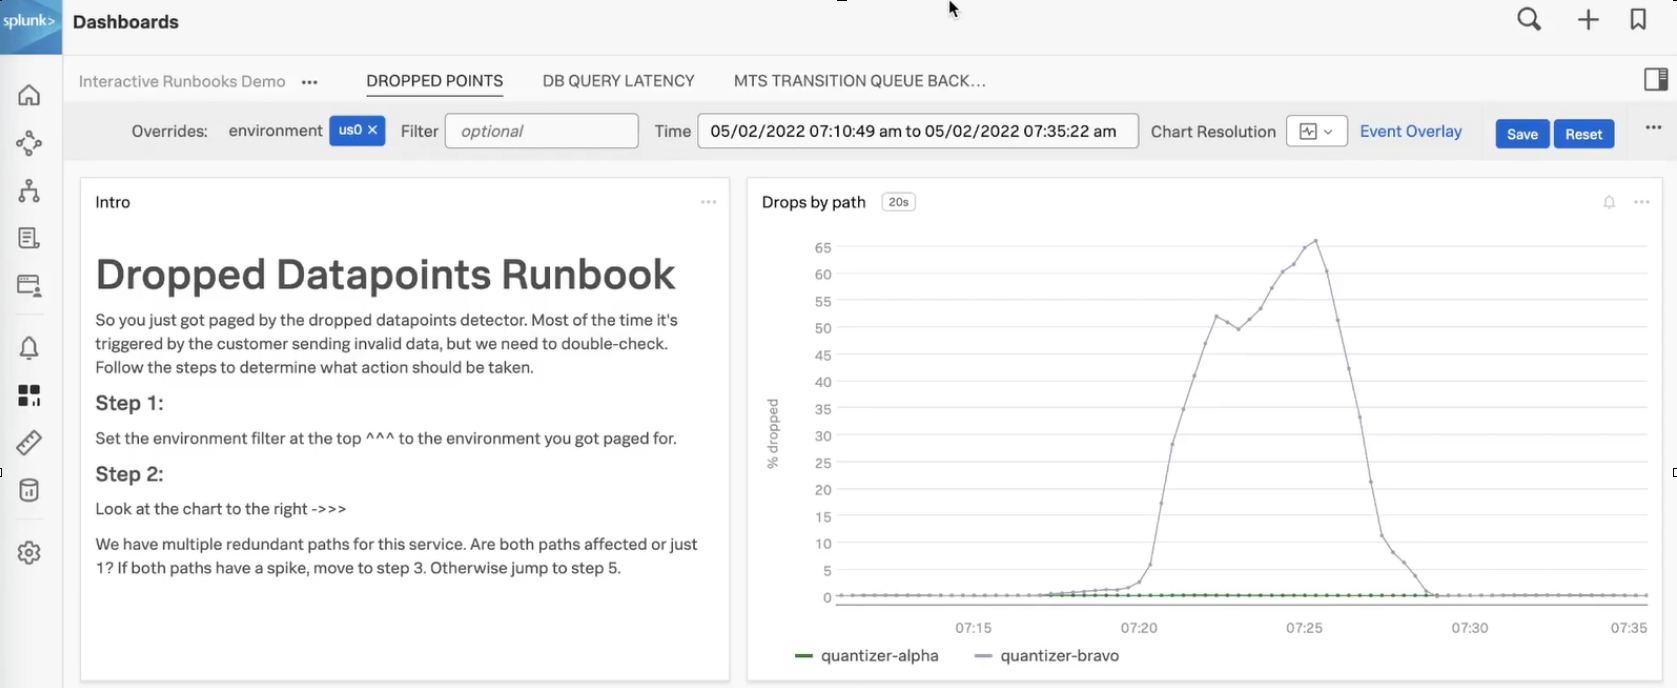
The first image below for this interactive runbook shows steps 1 and 2. Notice the following:
- The title is followed by a brief description of what the detector does. A clear title and description help on-call engineers know that they are looking at the correct runbook.
- The text block is side-by-side with the accompanying chart the on-call engineer needs to use to start determining the problem.
- The text gives clear guidance to the on-call engineers about what they should look for in the chart, and what step they should go to next depending on what they see.
This example has only one chart, but you can add multiple charts next to each text block. If there are multiple potential causes for an alert, seeing each relevant chart at the same time can help the on-call engineer determine where to start an investigation.
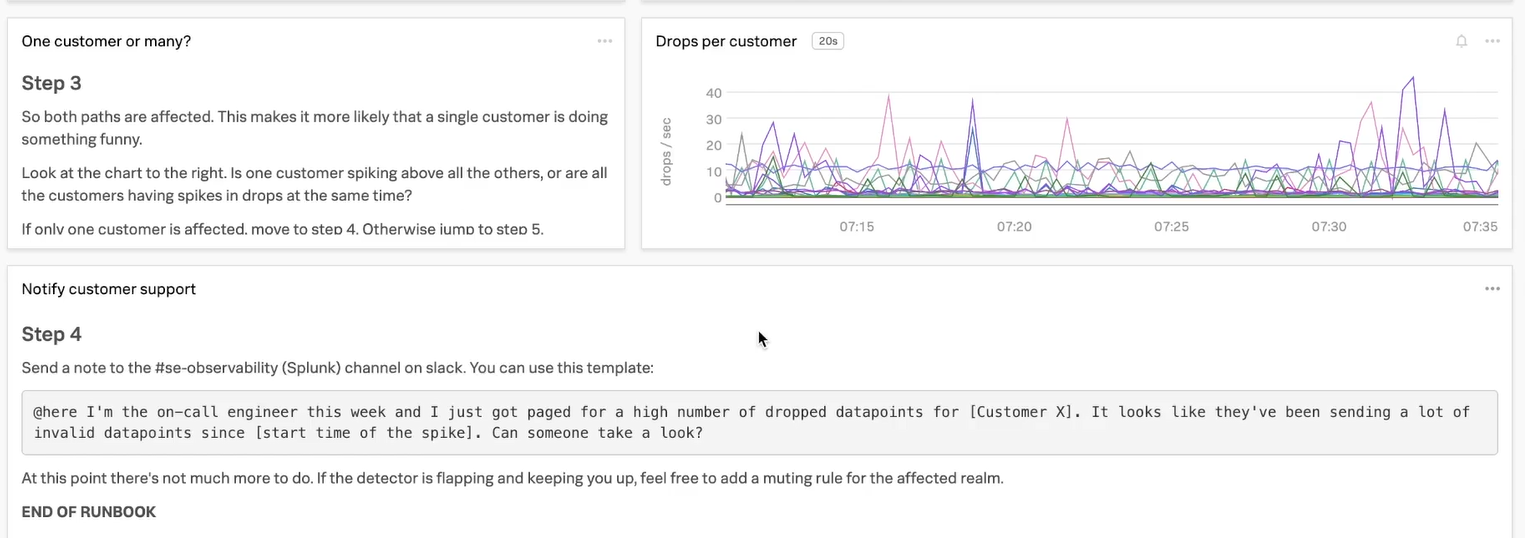
In steps 3 and 4, note the following:
- All steps are clearly numbered in a larger font. These visual clues help on-call engineers follow a clear workflow.
- Each panel - text or chart - has a title and the axes on the chart are labeled.
- The runbook provides boilerplate language for the on-call engineer to paste into a Slack channel, support ticket, or other response mechanism. The modifications the on-call engineer needs to make are clearly indicated with brackets. Templates like this speed up remediation time.
- Step 4 clearly tells the on-call engineers that their work is finished after they send the note.
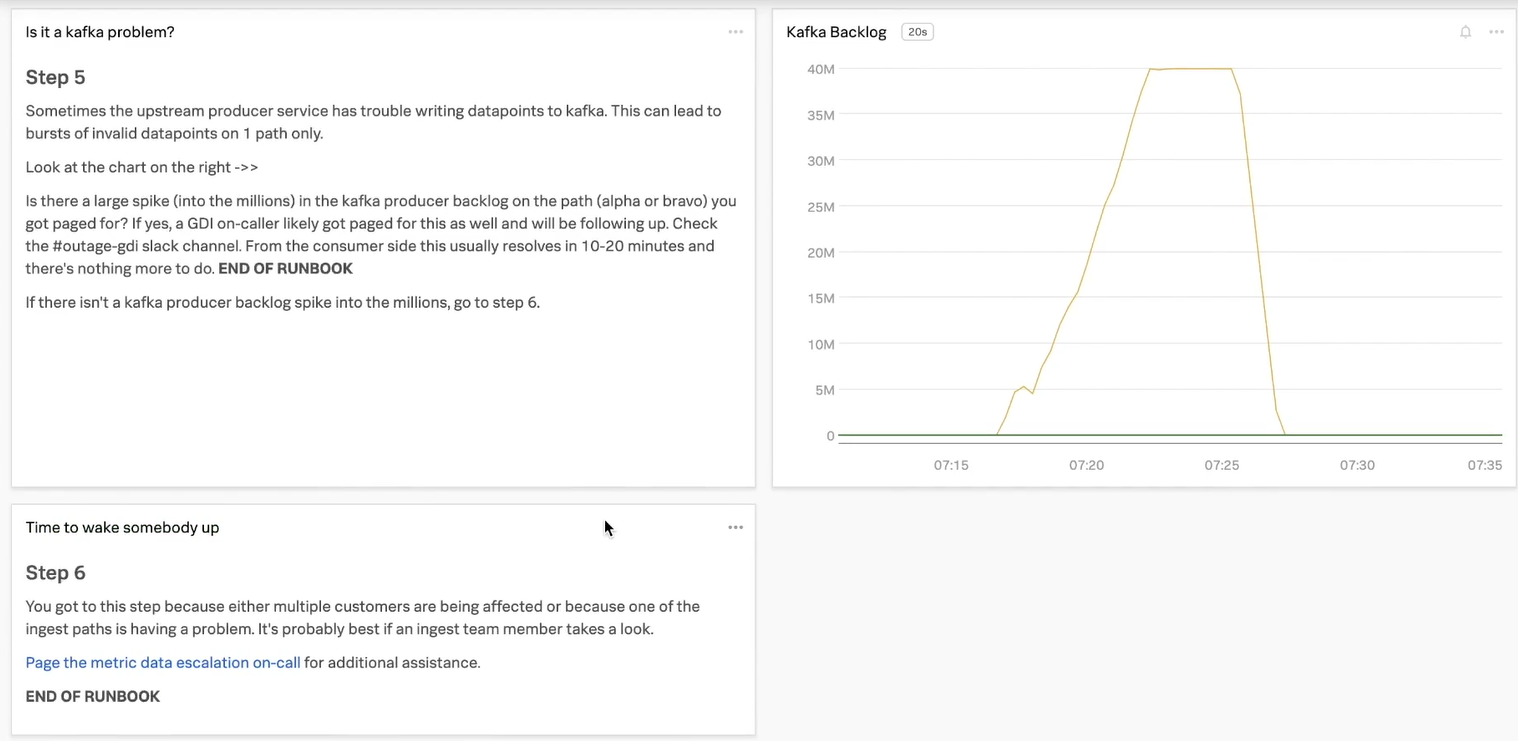
If the on-call engineer skipped to step 5 after step 2, they come to these two steps. Note the best practices in steps 5 and 6:
- Step 5 presents an alternate cause for the alert, which is indicated clearly with the heading, and another corresponding chart.
- Step 6 provides a direct link to escalate. On-call engineers should not have to search for a link or email address, as doing so slows down time to resolution.
- Step 6 also provides an explanation of why the escalation is necessary at this point, so the on-call engineer can make sure it aligns with the steps they have taken so far to rule out other causes.
While some of the best practices above might seem obvious or unnecessary, remember that not all on-call engineers are thoroughly familiar with each service they need to monitor. The more clear and simple guidance they have in the runbook, they less confusion there is and the less likely they are to escalate a call to the service owner.
Next steps
Now that you understand some best practices for creating interactive runbooks in Splunk Observability Cloud, watch the demo in this .Conf22 Talk (Reducing time-to-resolution with interactive runbooks) to see how Splunkers created two more interactive runbooks for the following common use cases:
- Database query latency
- Transition queue backlog (a detector to trigger on too many messages backed up between two services in a Kafka queue)
Then start building your own!