Using OpenTelemetry processors to change collected backend data
Telemetry data is critical for helping you understand performance better within your distributed environment, as well as helping DevOps and IT groups better understand behavior and performance in your systems.
To get the most from your telemetry data it has to be captured and analyzed, then tagged to add relevant context, all while being sure to maintain the security and efficiency of user and business data. The OpenTelemetry Collector and its processing capabilities can help to manipulate data before it’s sent to an observability system.
At its core, Splunk Observability Cloud uses the OpenTelemetry observability framework. OpenTelemetry offers vendor-agnostic APIs and software development kits (SDKs) for collecting telemetry data from cloud-native applications and their supporting infrastructure, and the OpenTelemetry Collector can aggregate and send this data to a commercial analysis system like Splunk Observability Cloud or open-source ones like Prometheus.
The Collector uses pipelines to receive, process, and export metric and trace data with components known as receivers, processors, and exporters. In this article, you'll learn how processors can work with your application’s telemetry to help you achieve better security and efficiency.
Securing and improving application efficiency with processors
In the OpenTelemetry workflow for a trace event, a trace is generated by the application, received by a receiver, and then manipulated by a processor before being exported by exporters.
The Splunk Distribution of the OpenTelemetry Collector offers support for various processors for different use cases. For example, the attributes processor is responsible for modifying attributes of a span within a log or trace by using supported actions identified within the collector’s configuration. Actions are taken with a specific tag within the spans sent to the backend service.
Actions supported by the attributes processor
- Insert: Inserts a new attribute in spans where the key does not already exist.
- Update: Updates an attribute in spans where the key does exist.
- Upsert: Performs insert or update. Inserts a new attribute in spans where the key does not already exist and updates an attribute in spans where the key does exist.
- Delete: Deletes an attribute from a span.
- Hash: Hashes (SHA1) an existing attribute value.
- Extract: Extracts values using a regular expression rule from the input key to target keys specified in the rule. If a target key already exists, it will be overwritten.
You might find that you use auto-instrumentation for your workloads that might contain telemetry that must be secured. For example, if your customer ID tag is the customer’s email address, you may not want that address stored in your observability system. In that case, the hash action is a perfect choice, using SHA1 to hash the contents of an attribute exported to Splunk Observability Cloud. If you use this action, the sensitive data is converted into a string that can be stored safely, as the hashing operation is not reversible. The delete action is another good option for removing the attribute from the telemetry exported to the service.
Another example might be batch processors. The batch processor accepts spans, metrics, or logs and places them into batches to better compress the data and reduce the number of outgoing connections required to transmit the data. You should configure the batch processor on every collector to improve the overall efficiency of your data sent to your observability system.
Configuration options for batch processors
send_batch_size (default = 8192):The number of spans, metric data points, or log records after which a batch will be sent regardless of the timeout.timeout (default = 200ms):Time duration after which a batch will be sent regardless of size.send_batch_max_size (default = 0):The upper limit of the batch size. 0 means no upper limit of the batch size. This property ensures that larger batches are split into smaller units. It must be greater or equal to send_batch_size.
How are processors implemented?
To implement processors, you should understand the basics of the OpenTelemetry configuration file. The OpenTelemetry Collector configuration file is written using YAML and composed of the following parts to create a pipeline definition:
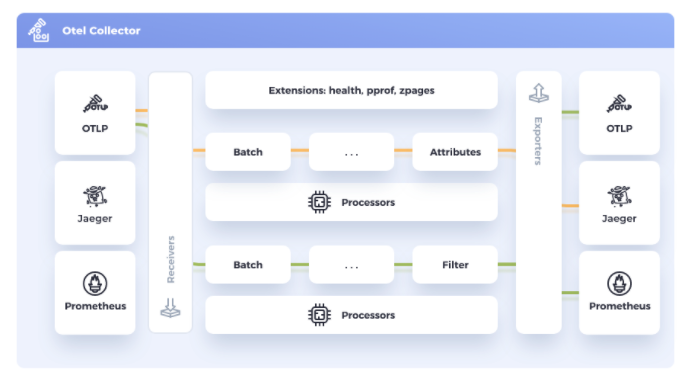
- Receivers: How to get data in. Receivers can be push or pull-based.
- Processors: What to do with received data.
- Exporters: Where to send received data. Exporters can be push or pull-based.
- Extensions: Provide capabilities on top of the primary functionality of the collector.
Each of these components is defined within their respective section and enabled within the service section. Each of the component configurations is highlighted by a different color. Receivers in yellow, processors in green, and exporters in blue. Under the component definition section is the service section, where for traces otlp is used as the receiver, batch for processors, and sapm for exporters. This is the recommended configuration for Splunk Observability Cloud, but by changing the exporter, data can be sent to other platforms as well.
In the example configuration below, you can see the attributes processor is now defined to hash any key named ssn. Note the configuration below in bold. You can use the action hash and identify the key ssn in the appropriate YAML format.
#Define each component.
Receivers:
  otlp:
   protocols:
     grpc:
       endpoint: localhost:4317
     http:
       endpoint: localhost:55681
processors:
 batch:
 #Definition for attributes processor. Delete any key that might contain "ssn".
 attributes:
  actions:
    - action: hash
      key: "ssn"
exporters:
 sapm:
   access_token: YOUR_TOKEN
   endpoint: https://ingest.us0.splunk.com/v2/trace
#Enable components.
service:
 pipelines:
   traces:
     receivers: [otlp]
     #attributes processor enabled.
     processors: [attributes]
     exporters: [sapm]
Without the processor in place, the span shows the user’s social security number (SSN) in plain text. With the processor in place, the span shows the user’s SSN in a consistent, but secure and unreadable format. Any trace with the SSN of 123-45-6789 will use the same hashed value in your observability system.
You should not rely on this method for truly sensitive data like SSNs. The best practice when working with data of that level of sensitivity is to delete it using the processors delete action, and to instead emit a different tag in your application.
How can I access the Splunk Distribution’s OpenTelemetry Collector configuration file?
The Splunk OpenTelemetry Collector is configured using agent_config.yaml. This is located in /etc/collector/otel for Linux (Debian/RPM) and \ProgramData\Splunk\OpenTelemetry Collector\ for Windows. By default, you will find it contains the recommended starting configuration for most environments.
If you’re using a different distribution, the configuration file might live elsewhere but should be able to be manipulated in the same way, using whatever processors are provided by your vendor.
Processors can be very useful to modify attributes of a span, compress your telemetry data, and help with including or excluding metrics within your telemetry. By default, several processors are enabled with the Splunk OpenTelemetry Collector to best work with the service. Depending on the data source and your requirements, you might need to enable additional optional processors.
Next steps
The content in this article comes from a previously published blog, one of the thousands of Splunk resources available to help users succeed. In addition, these resources might help you understand and implement this guidance:
- Docs: Install and configure Splunk Distribution of OpenTelemetry Collector
- OpenTelemetry: Processors