Debugging frontend errors
You are looking to improve how errors are debugged. You're finding it difficult to prioritize and isolate JavaScript errors, but this is an essential part of the workflow you follow in order to improve end-user experience, so you need to find a good solution to this issue.
Frontend error monitoring helps you identify your most frequent JavaScript errors by message and type, and provides stack traces and user session data from every error to recreate the issue locally, connected with relevant traces from backend services. Along with RUM for Native Mobile Apps, Splunk Synthetic Monitoring, Splunk Application Performance Monitoring (APM), Splunk Infrastructure Monitoring, log management, and incident response capabilities, frontend error monitoring helps you extend observability into debugging throughout the software development lifecycle.
How to use Splunk software for this use case
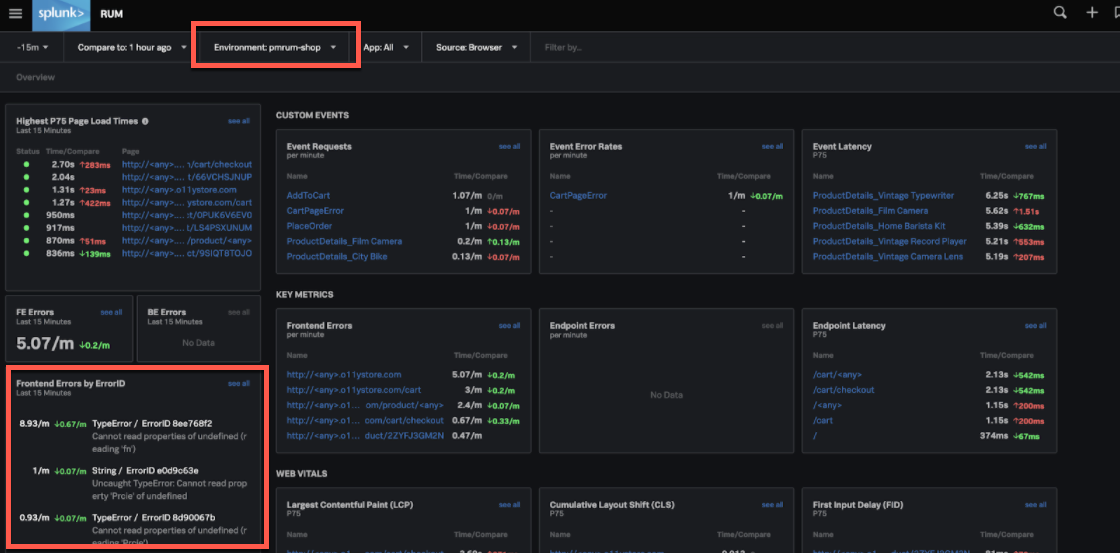
- Open the Splunk Real User Monitoring summary screen to view overall client-side performance. You’ll notice Frontend Errors by ErrorID in the left side panel. This provides you with the top ten errors by stack trace over a given time period, environment, and application. In this example, you can see the last 15 minutes within all the applications in the pmrum-shop environment. You can see error frequency, with additional context about error type and specific error messages being returned.
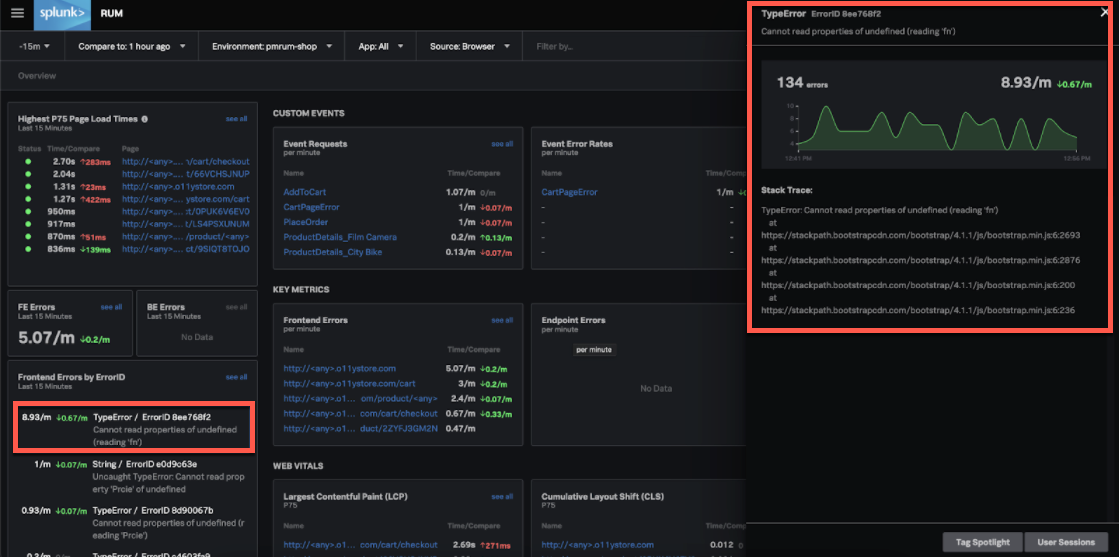
- Select an error. This gives you additional context on total error count and how the error is trending, plus all stack traces collected each time this error has occurred. In the example shown below, ErrorID 8ee768f2 has been selected. You can see that the error has an undefined function, and has occurred 134 times.
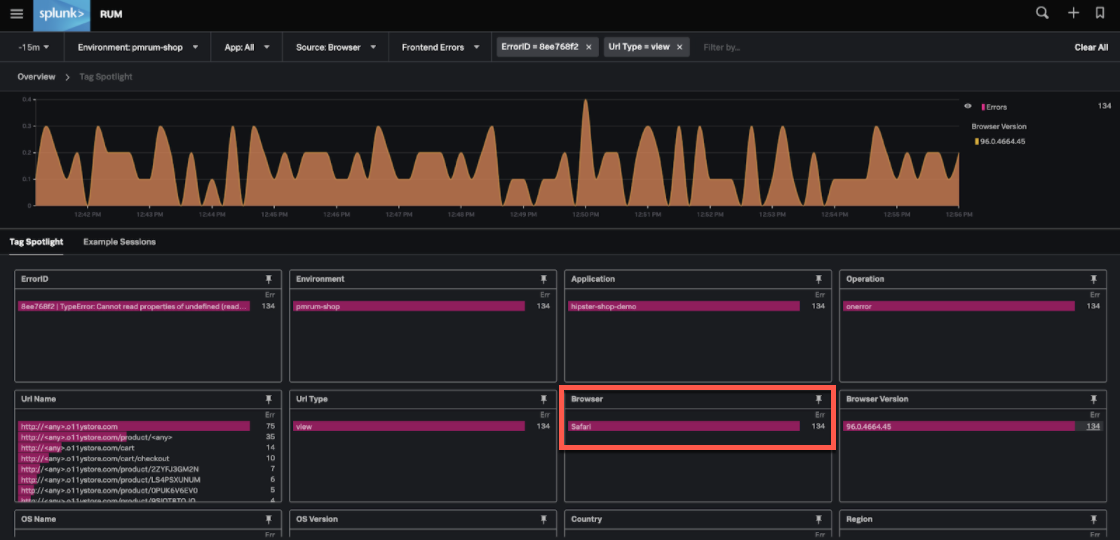
- Click anywhere in the error overview to open Tag Spotlight. This helps you understand common criteria of this error. ErrorID 8ee768f2 occurs on several URLs across your user funnel, but only on Safari version 96.0.4664.45. You can also understand error frequency by country and region to scope the error’s geographical impact.
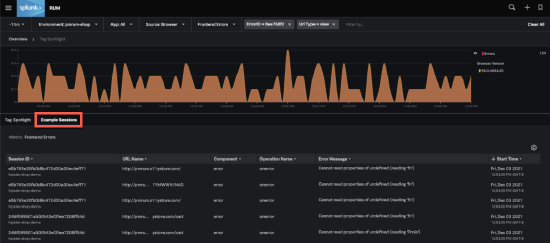
- Click Example Sessions. Here you can view the entire transaction across the user session. Splunk Real User Monitoring connects automatically with Splunk Application Performance Monitoring and throughout the observability suite, so you have end-to-end visibility and context into where the frontend error occurs alongside relevant APM traces from backend services.
- Click a session ID to view the full transaction. This can help you understand how errors impact customer experience and system performance. Here you can see see ErrorID 8ee768f2 in context of the entire transaction, alongside all trace data.
Next steps
The content in this guide comes from a previously published blog, one of the thousands of Splunk resources available to help users succeed. In addition, these Splunk resources might help you understand and implement this use case: