Optimizing mobile app startup processes
You work as part of an on-call rotation that is committed to measuring and optimizing key Service Level Indicators (SLIs) within mobile apps. Two typical SLIs that you monitor are App Startup Time and interactive time (sometimes called “Time to Ready''). These metrics measure how long it takes for your apps to be fully functional and ready for user interaction. You need to learn some best practices for managing the processes related to changes in these metrics.
Data required
How to use Splunk software for this use case
In order to keep track of the results and progress made, you should create charts and alerts within Splunk Real User Monitoring that send an alarm to an On-Call Engineer whenever your SLIs don’t meet your standards. Here is an example chart and alert:
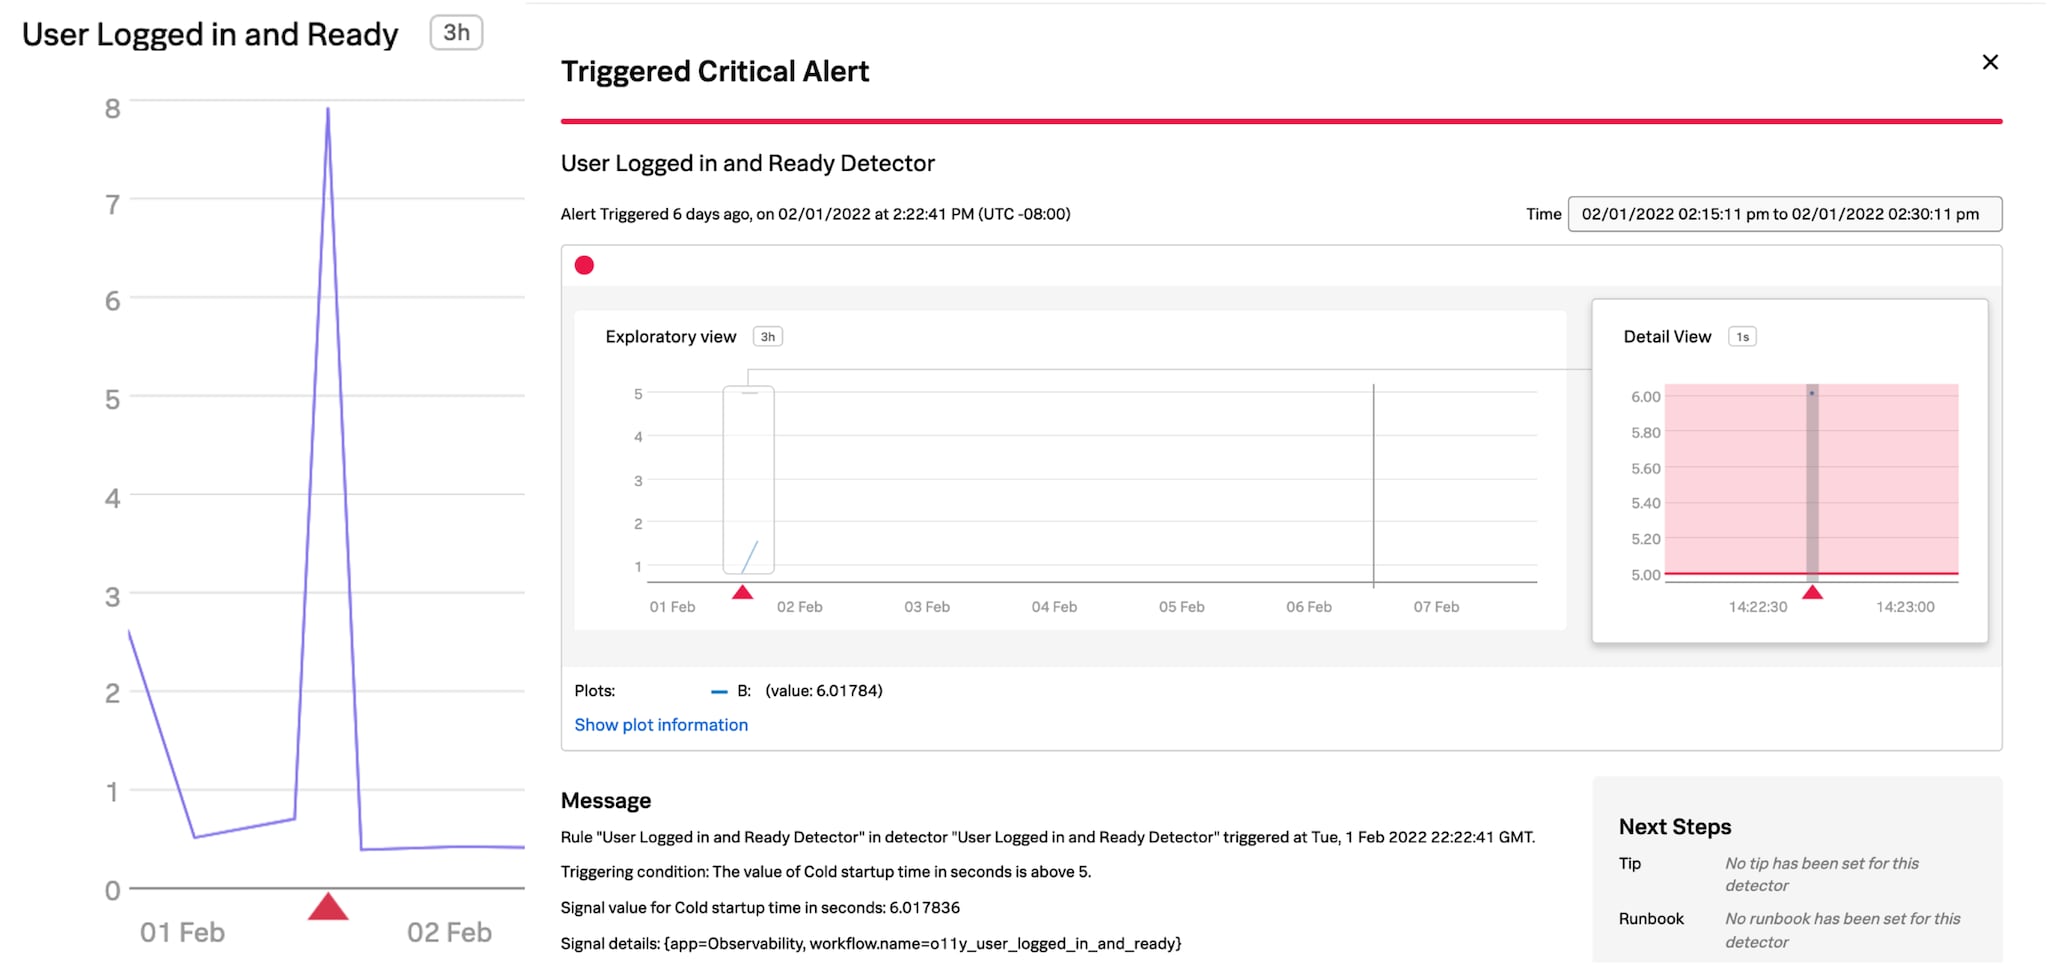
In this instance, your On-Call engineer should be paged when the p75 of App Startup Time or Time To Ready is over 5 seconds.
When paged, the engineer should break down the metrics by platform, app version, and OS version to identify whether new code is impacting the performance. In addition, it's possible to access detailed information in the Session Details page of Splunk Real User Monitoring for each instance that App Startup Time or Time to Ready is longer than expected.
Using a process like this means that with every page received, SLIs are either incrementally improved or more custom events are added to gain a deeper understanding of the “Ready” sequence. You should also conduct post-incident review meetings to discuss each page and the action taken to improve your App Startup Time and Time to Ready.
An example of real-time observability in action
Here is a real example of this real-time observability process in action. In this example, upon receiving a page, the Engineer handling the issue identified that the “o11y_fetch_and_store_dashboards” time was extremely long in a large customer's environment.

During the incident, the Engineer identified that the API response time to retrieve user preferences was extremely high. Though this API call was expected to be seen multiple times for large data sets, only one was seen, indicating that large data sets were expected to be paginated.
The Engineer connected the Splunk Real User Monitoring trace back to Splunk Application Performance Monitoring to learn more and found that the primary query used was suboptimal and did not paginate the results as they had expected it to. On putting in a hot fix for the API that this impacted, Time to Ready was immediately reduced by 10%.
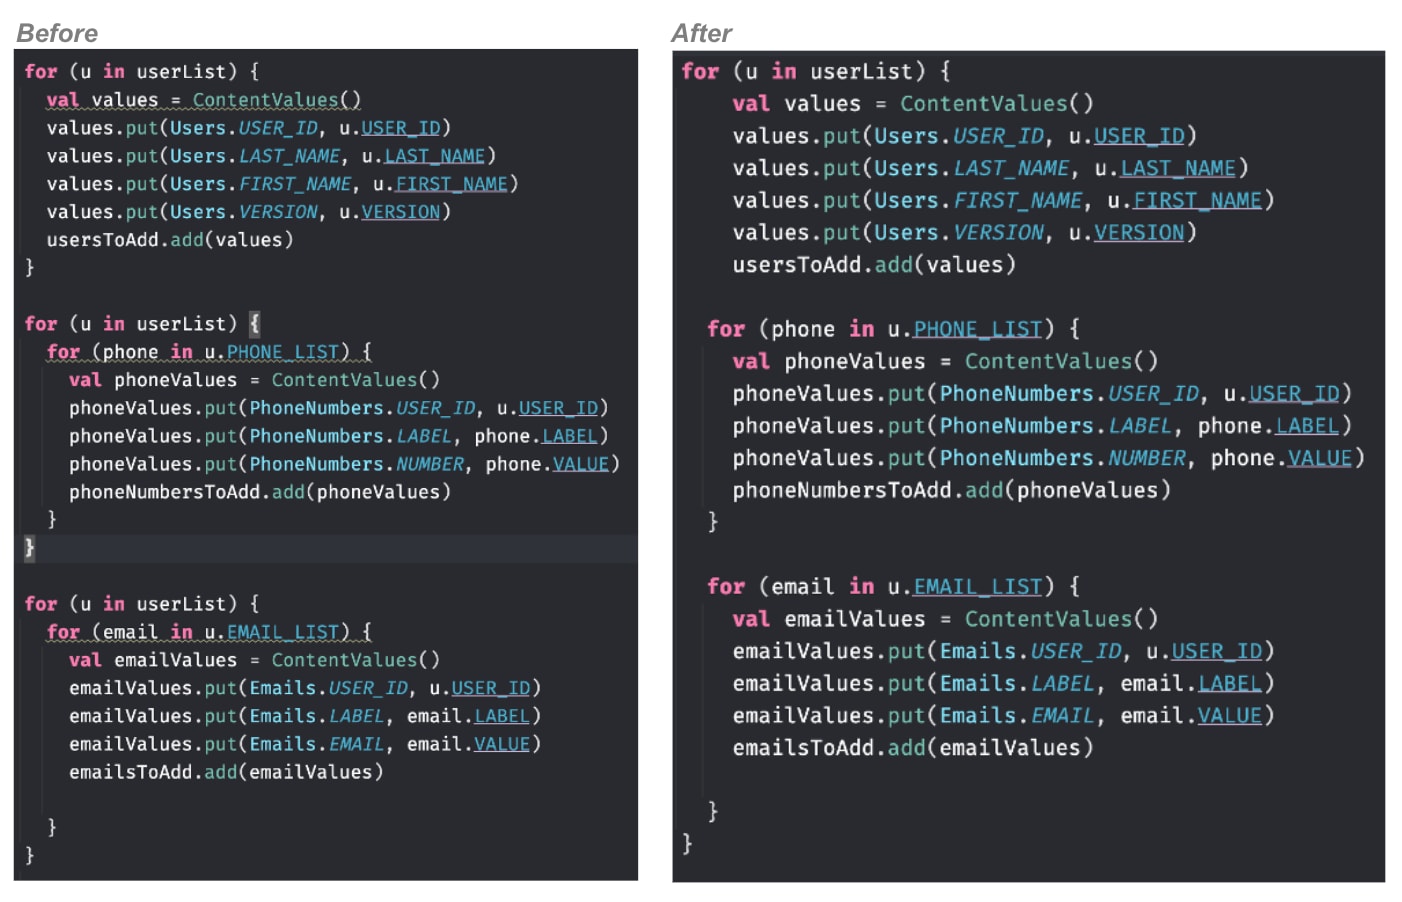
The metrics collected pointed the team to code where a contact list was being looped through to extract fields. The loop took over 50% of the overall Time to Ready duration. It was identified that the code looped through the contact list three times to extract key fields, leading to a long o11y_dashboard_list_favorite_load_time.
The suboptimal code had gone unnoticed in QA environments as the iterations were fast on short contact lists, but in a live environment it was extremely slow for large customers and the problem was exacerbated. By optimizing the code to loop through the contact list only once, up to 5 seconds was reduced for large customers in the subsequent release, improving Time to Ready performance by 33%.
Next steps
The content in this article comes from a previously published blog, one of the thousands of Splunk resources available to help users succeed. In addition, these resources might help you understand and implement this guidance: