Optimizing the performance of single page apps
You are an SRE or web developer who has been building a single-page app for your organization. The app is finally up and running, and you want to measure its performance. There are a few different stats you decide to use to track this - your app's Lighthouse Score, Speed Index, its onload time and the total amount of content within the app.
On your first measurement, these scores are not looking too good, so you need to find ways to optimize your app's performance. You notice that your file sizes in particular are quite large, and since your application contains a lot of media content, optimizing this seems like a good first step to take in reducing load times.
This feature is only available in the Rigor platform. Rigor will reach end of life on Feb 28, 2025. For more information, see the Frequently Asked Questions. Synthetics users (regardless of platform) can still create synthetic tests and pull the results into custom dashboard charts to monitor their performance.
Data required
How to use Splunk software for this use case
- First, you'll need to run some tests to see your baseline performance scores in Splunk Synthetic Monitoring. Open up Splunk Synthetic Monitoring and click on the Real Browser menu option.
- Under Basic, select the locations you want to use to test with and the test frequency.
- Under Advanced, choose the viewport size and the connection you want to test with.
- Under Steps, select what parts of your app you want to be testing. You could track how all elements are loading on the page, or focus on a specific process such as the registration or buying process.
- After the test has run you'll be able to see a report of its results. The locations you chose in the settings previously will be visible here, with different location's loading speeds shown with different lines in the chart. Since application speed is relative to user location, it's likely you'll find locations that are furthest from you loading more slowly.
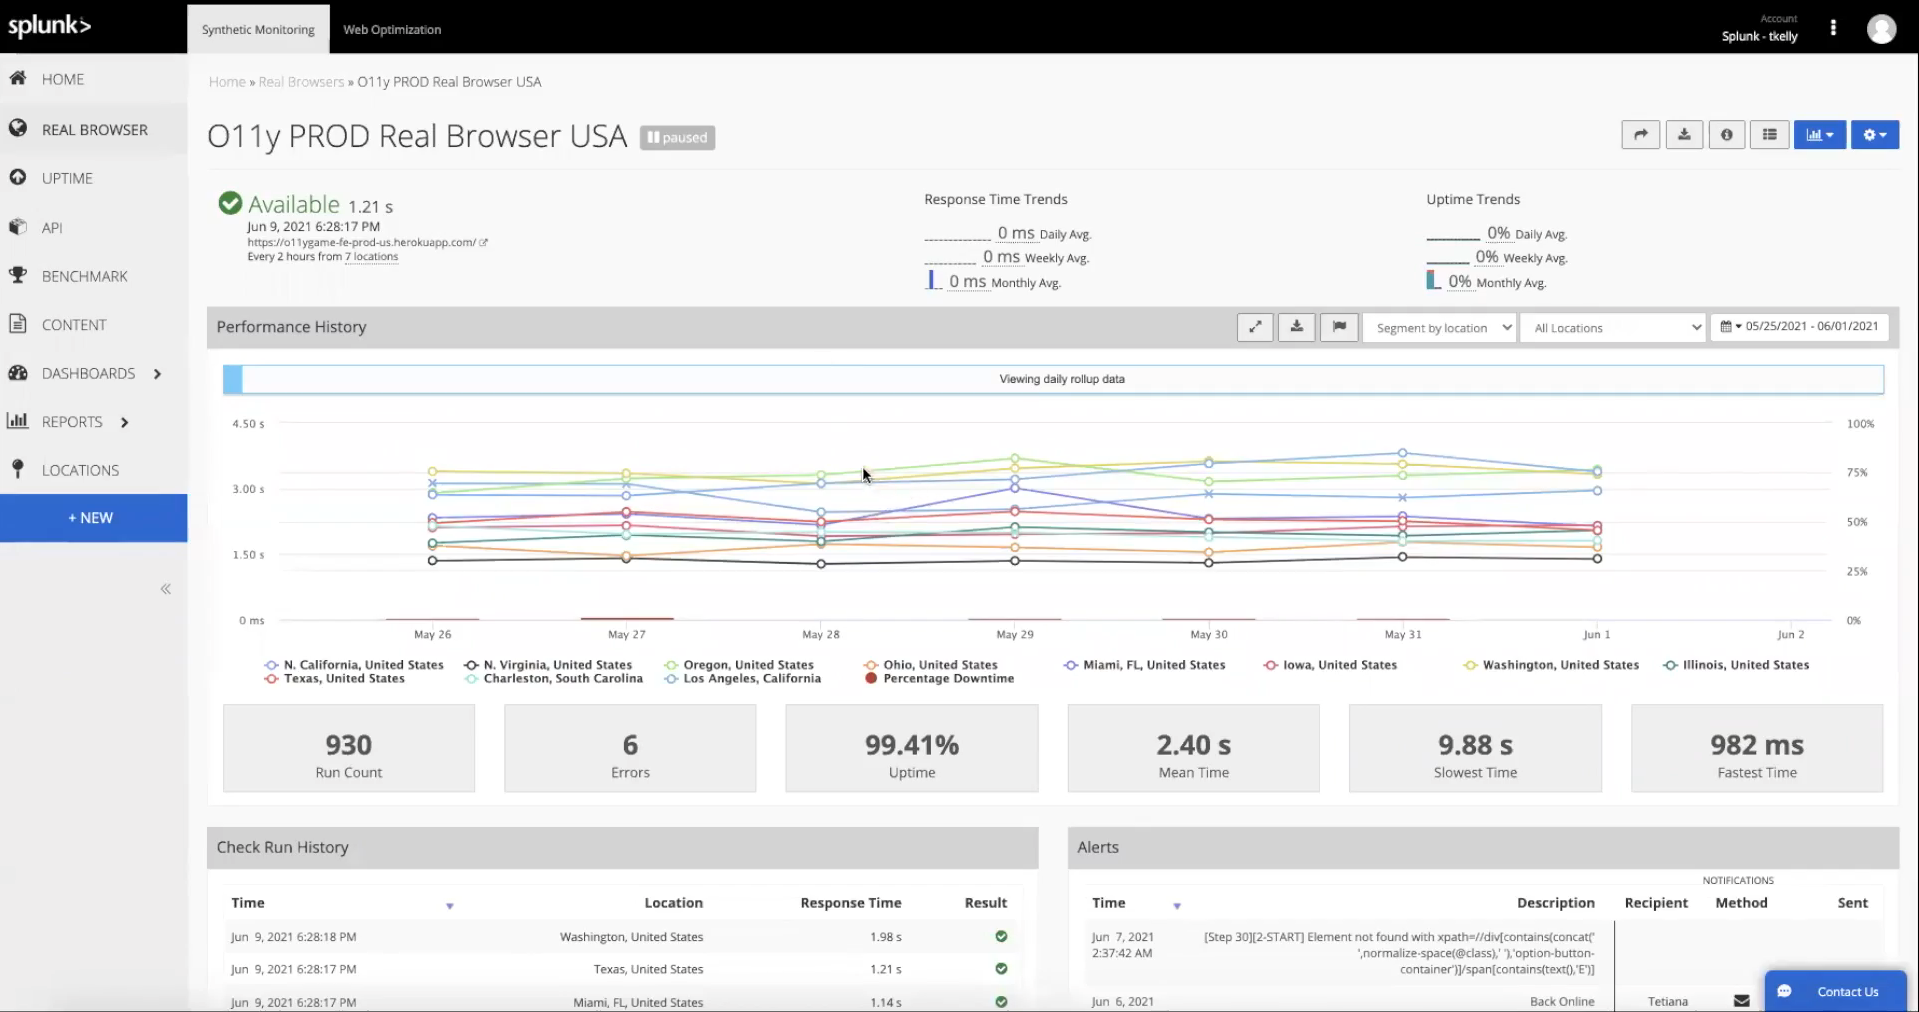
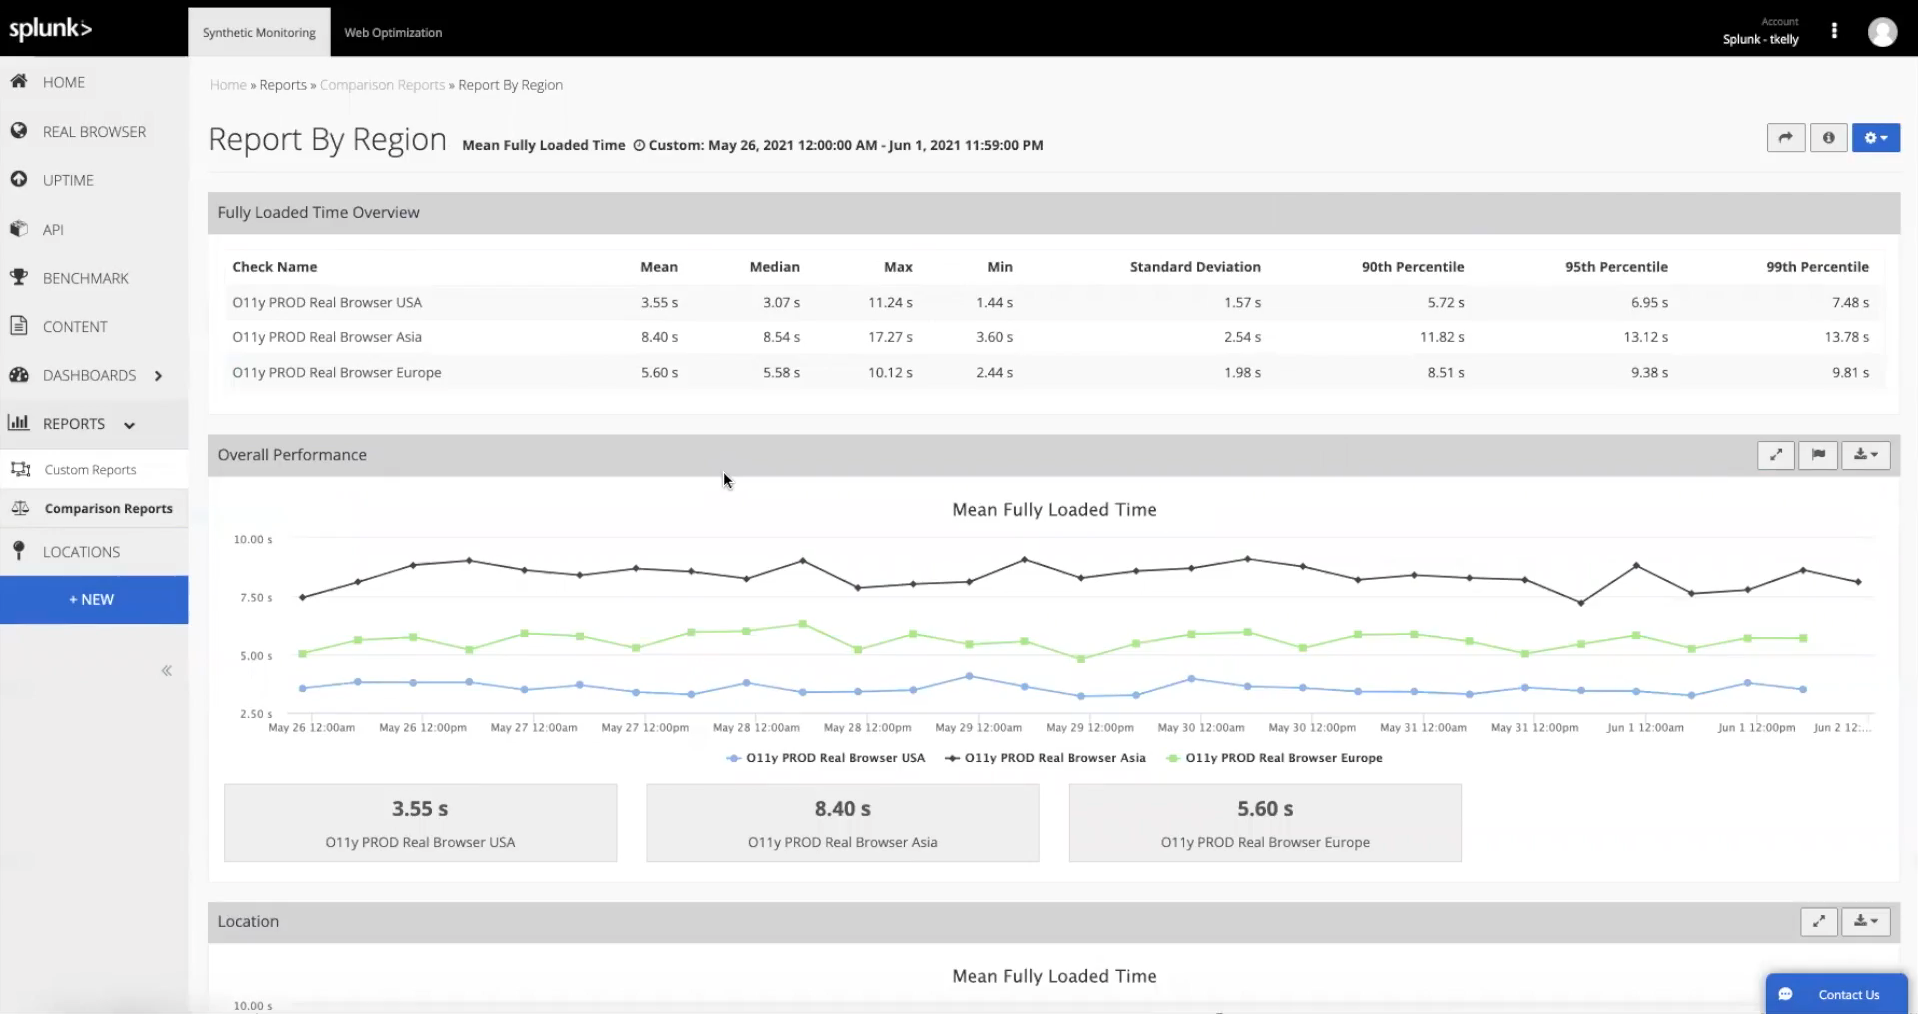
- By clicking into any of the data points on this initial chart, you can access test results by region.
- Click into a data point then click Show Metrics to access a number of different metrics you can view to understand your performance. Each test collection exposes over 30 different performance metrics so you can select whatever is the most important for your business and report on these metrics over time.
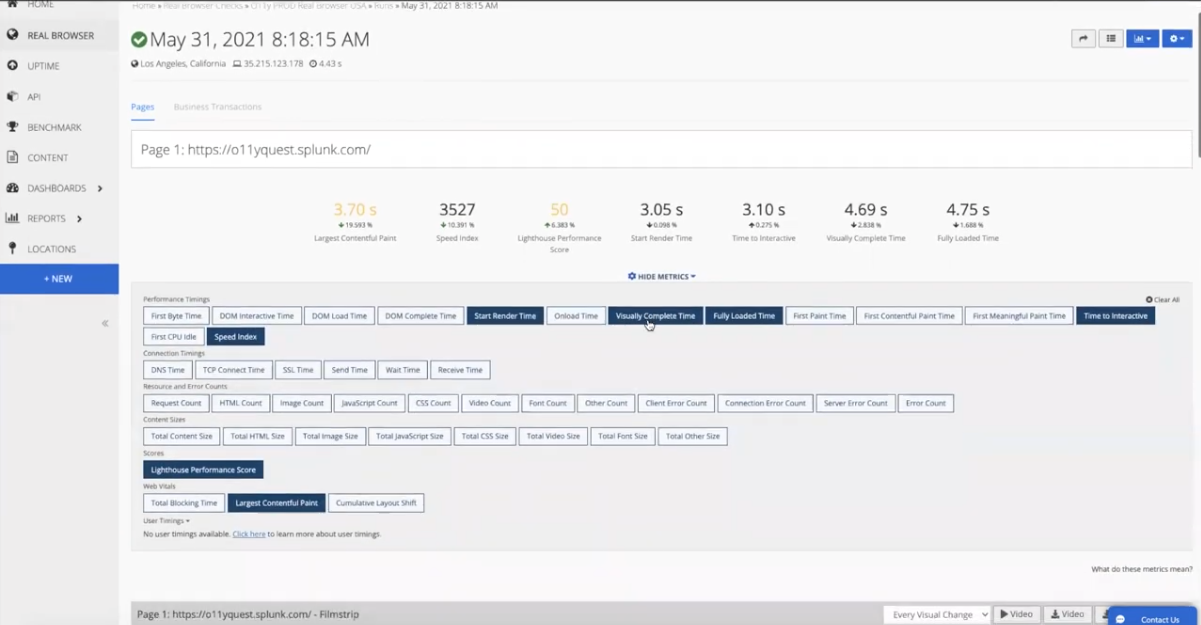
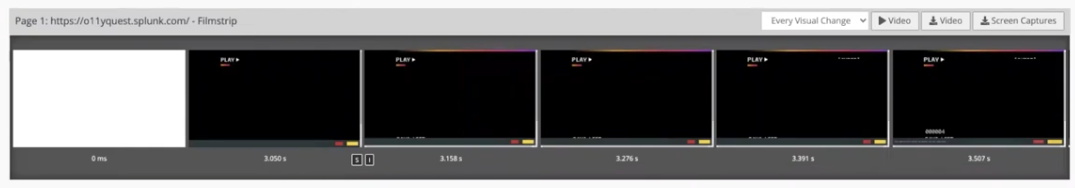
- Hiding this metrics area means you can view a filmstrip to see visually what load performance looks like over time.
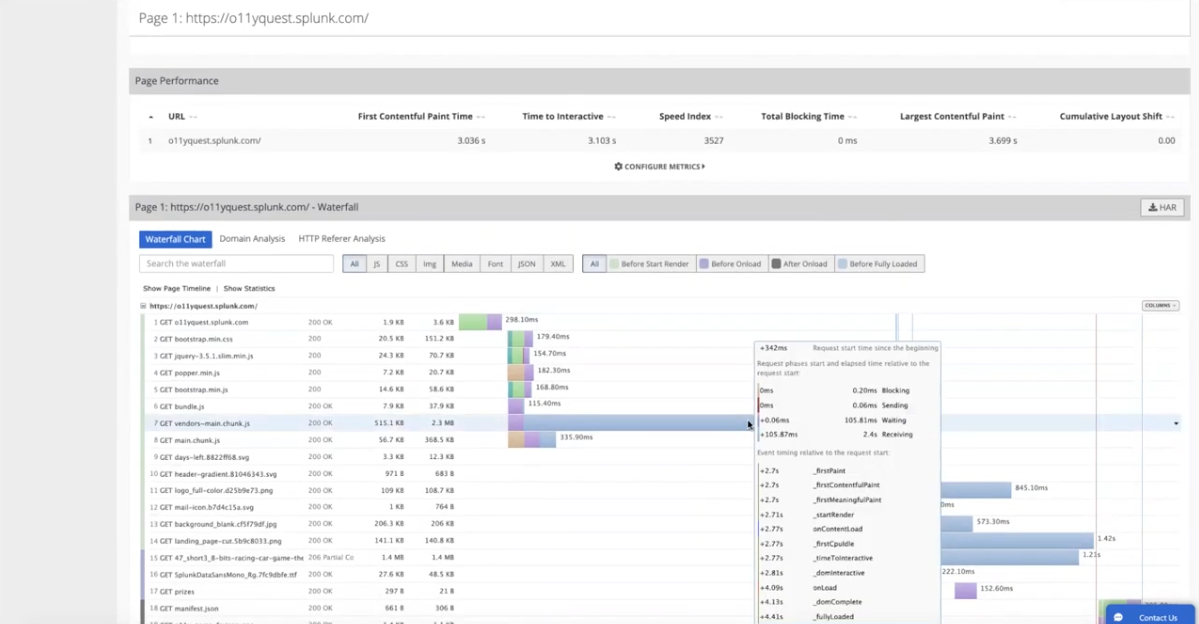
- Scrolling down the page, you can see a waterfall chart. This allows you to see what's really going on behind the scenes on user machines, showing how long individual files and images take to load.
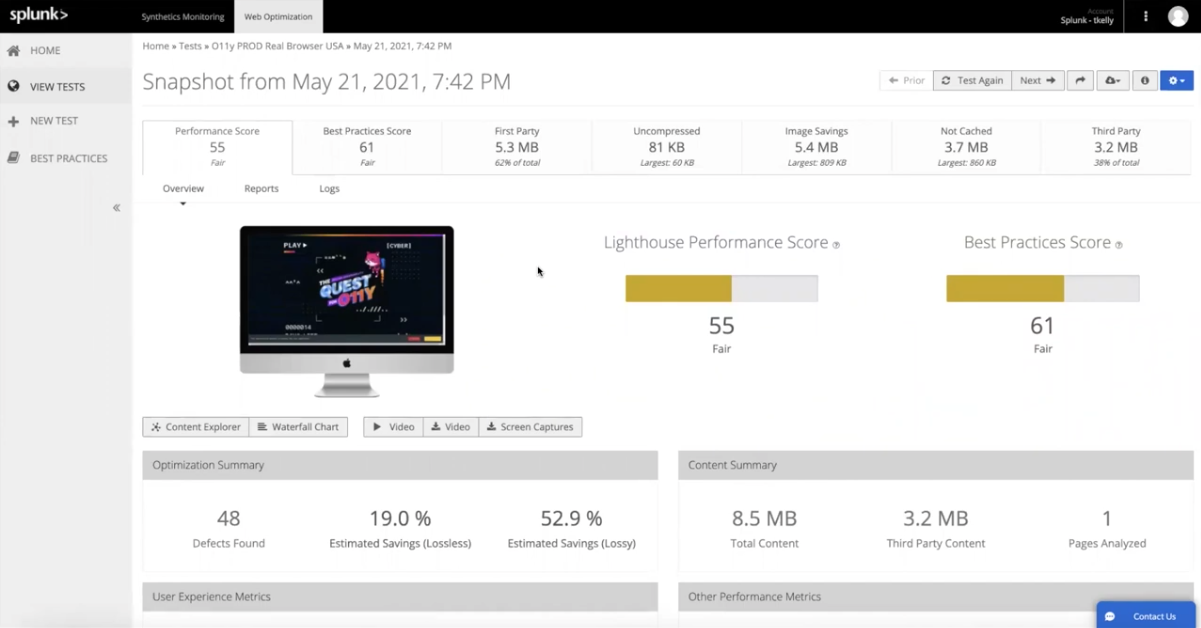
- Select Click here to Analyze with Optimization to identify what types of defects or bugs are presented on the page. This takes you to the Web Optimization tool which programmatically generate a full report of all defects. In the below example, 48 defects have been found. Scrolling down the page shows you all defects sorted by severity, and a simulation of total savings is also produced for each defect.
- Clicking into a defect shows you a fuller report of the issue associated with it. As well as showing performance stats, each defect provides you with examples of how it can be fixed.
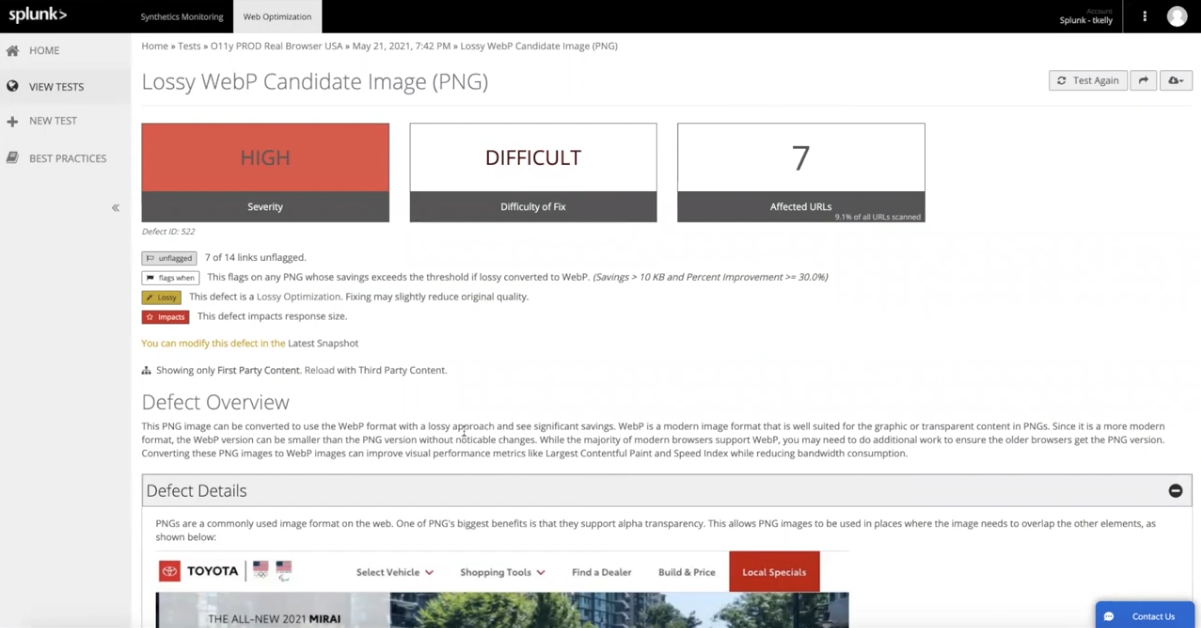
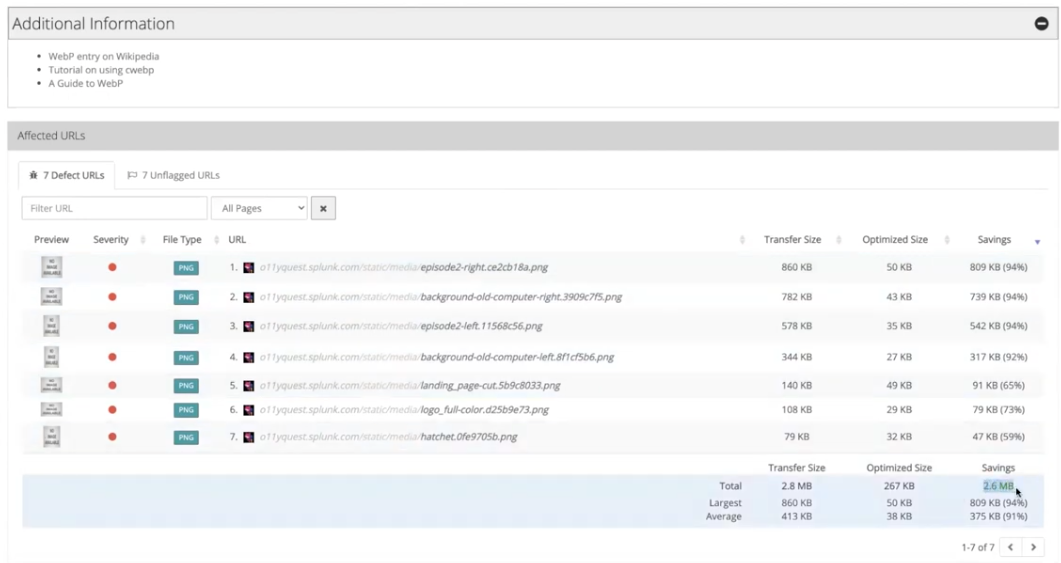
- In this example, the image we are looking at could be converted to a different format for faster load times.

- Scrolling down further, you can see a report showing similar files that could be converted, with the total performance savings also listed.
- After you have made changes to the files and media that have been identified as needing optimization, you can re-run the Real Browser report to see the impact of your performance improvements.
Next steps
The content in this guide comes from a .conf21 session, one of the thousands of Splunk resources available to help users succeed. In addition, these Splunk resources might help you understand and implement this use case:
These additional Splunk resources might help you understand and implement these recommendations: