Monitoring AWS Lambda infrastructure
AWS Lambda enables companies to increase the pace of software innovation by running backend code without provisioning infrastructure, managing server applications, maintaining security patches, or performing other administrative tasks – making it possible for developers to run backend code without needing to manage their own server systems or server applications.
However, it presents its own set of monitoring and observability challenges:
- You don't have access to underlying hosts, so you can't install agents to collect metrics.
- When your function is invoked, AWS initializes a container to run your function. When this happens for the first time in a while, there may not be an idle container available to run your code – adding latency to the total time needed for your function to execute.
- Functions are highly ephemeral and are spun up and down in seconds, if not milliseconds. You need immediate and ongoing visibility into function performance so that you can make adjustments to your functions or resolve issues before customers are impacted.
You want to be able to monitor these key Lambda metrics:
- Cold starts. The average latency, and total number of function cold starts.
- Errors. The number of invocations that failed due to errors associated with the function.
- Invocations. The number of times a function is invoked in response to an event or invocation API call. This includes successful and failed invocations, but not throttled attempts.
- Compute duration. The time from when your function code starts executing as the result of an invocation to when it stops executing. This metric directly affects AWS billing
- Business and customer experience metrics. Custom metrics relevant to how your functions are supporting your business, including user requests, checkout abandonment, revenue per location, and more.
Data required
Amazon Web Services: CloudWatch or Splunk OpenTelemetry Connector
How to use Splunk software for this use case
Collect AWS Lambda metrics from CloudWatch
To sync CloudWatch metrics for your Lambda functions to Splunk Infrastructure Monitoring, add AWS Lambda-specific statements to your Policy Document. Then, you’ll be able to view Lambda metrics in the Infrastructure Navigator and a number of pre-built dashboards. The Infrastructure Navigator gives you an aggregated view of system metrics across all of your functions, and the ability to filter down to the subset of functions you’re interested in using a variety of dimensions sent by default or by custom tags you’ve applied.
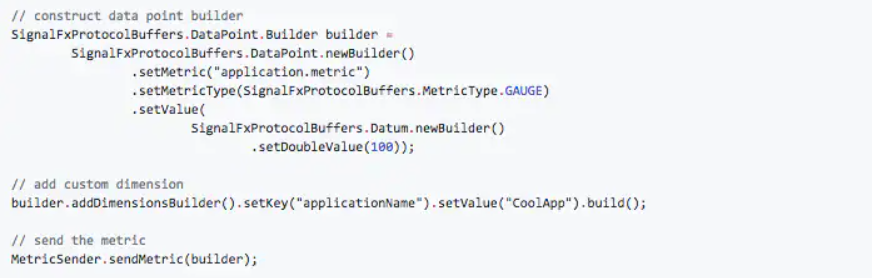
If you need to track function invocations or errors at a level more granular than CloudWatch can deliver, the Splunk Infrastructure Monitoring Github repository provides a function wrapper that includes calls to Splunk Infrastructure Monitoring with the count of invocations and errors, the execution duration, and whether the functions being called are being impacted by a cold start. These Lambda wrappers are available in Node.js, Java, Python, and C#. The wrapper also provides a mechanism to instrument your code for custom metrics that matter to you. To do so, add a few additional lines within your function to capture and send those metrics to Splunk Infrastructure Monitoring.
Finally, charts that use data collected by the wrapper can be configured to update more frequently than is possible with CloudWatch, and the default Lambda dashboard now includes information on whether your functions are being impacted by cold starts.
Trace AWS Lambda functions
You can also trace your Go, Java, Python, and Node.js Lambda functions with Splunk Infrastructure Monitoring, providing you with even greater visibility into the performance of your serverless applications. After instrumenting your functions and deploying the Splunk OpenTelemetry Connector, you’ll be able to observe request latency, duration, and errors for every transaction across your AWS Lambda environment.
Splunk Infrastructure Monitoring provides a dynamically generated service map that you can use to quickly isolate services that are contributing to latency or otherwise anomalous performance. When further investigation is required, you can use the Analyzer panel to immediately uncover patterns relating trace metadata tags to request duration, and begin to explain what might be contributing to degraded performance. From there you can review traces to further understand a particular trace, and immediately highlight which spans are contributing most to request latency or errors. You can also view metrics generated from spans by the Splunk OpenTelemetry Connector for historical analysis of how a particular trace is performing.
Next steps
These additional Splunk resources might help you understand and implement these recommendations: