Working with logs in Log Observer
Splunk Log Observer is no longer available for sale. For new customers interested in this functionality, we recommend you look into Log Observer Connect, which is free for Splunk Enterprise or Splunk Cloud Platform customers. For existing customers, Log Observer is still supported.
Review the Splunk Log Observer homepage
Splunk Log Observer uses a point and click interface that makes it easy to search, browse, filter and analyze your log data.
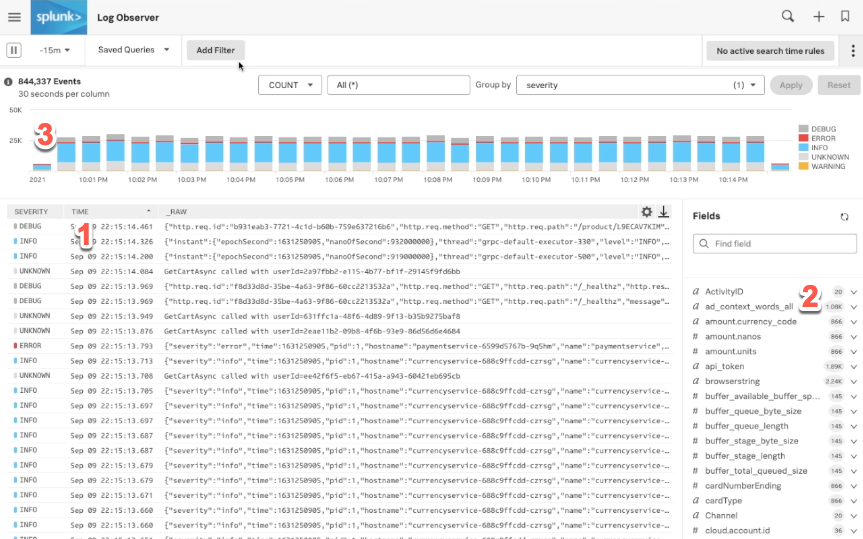
Start by opening up Splunk Log Observer. The homepage shows you:
- The Logs Table.
- A list of fields that you can browse through to search and filter your logs.
- A visual analysis area to transform and visualize your data to answer your questions.
Log messages list
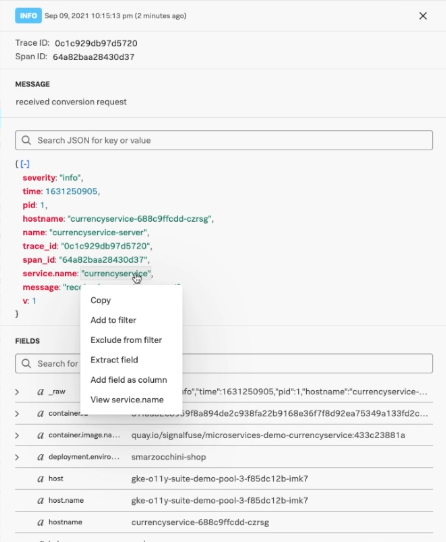
Clicking on one of these messages shows you all the details that came in with this message. You can read the message exactly as it came in, as well as see the fields that came in with this message, both in JSON format and as a complete list. Some fields are part of the OpenTelemetry standard, such as container ID or service name, so you can connect to other data.
Right-clicking on a field provides you with more interaction options:
- Copy and filter fields.
- Add fields as a column in a table view.
- Extract data from this field into a new field.
- For service data, view the service in the Splunk Application Performance Monitoring service map.
- For trace data, view the trace data in Splunk Application Performance Monitoring.
Fields
Fields give you another way to browse through your data by looking at the metadata that's come in across all of your logs. This works like a faceted search.
You can use this feature to see what metadata is available and explore the distribution of values that are coming in. You can then use this information to filter your log messages to the ones you're interested in.
.gif?revision=1&size=bestfit&height=565)
Visual analysis
Visual analysis is a big picture view of all the data that you're seeing in the messages list so you can see trends in your logs data over time. By default, the data will group by severity so you can see the volume of errors as they come in, but you can also see other things in this area, like errors by service, for example. You can apply a range of analytics functions to these, not only counts.
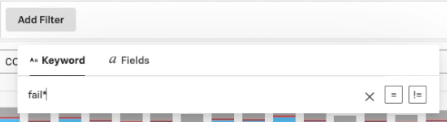
Search
Sometimes you know exactly what information you're looking for and you don't need to browse through your data. The easiest way to run a search is to input a keyword as a filter. If you aren't sure exactly what keywords you need to use, you can use a wildcard. You can also click Fields within the filter options to add a key value filter.
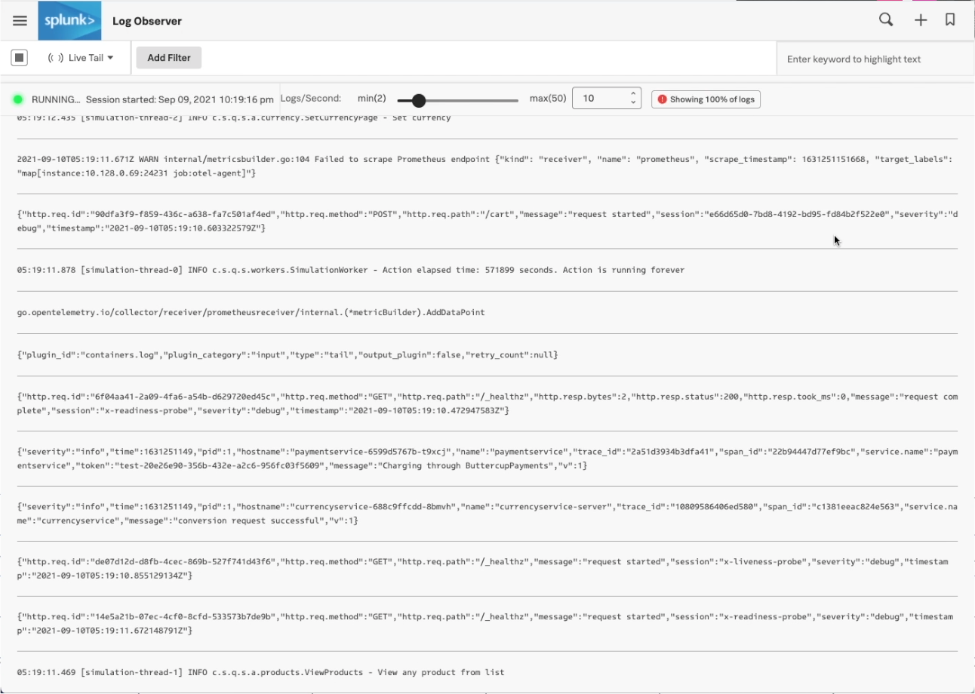
See real-time updates with Live Tail
Live Tail is useful for exploring, monitoring, and troubleshooting logs, all within a real-time stream. The logs are made available in the UI as they happen and are continuously updated as more logs are ingested. You can slow down or speed up the stream of logs to a frequency that works best for your purposes. Beyond that, you can filter the log stream and also apply keywords to the log stream in order to highlight specific keywords in the log lines.
This is helpful for locating specific log lines in the stream, or just to stay on top of errors, affected services, and other relative information found embedded in the logs.
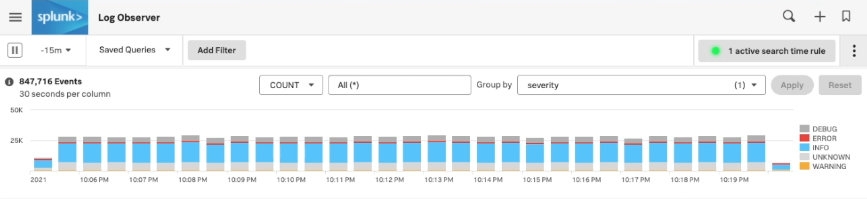
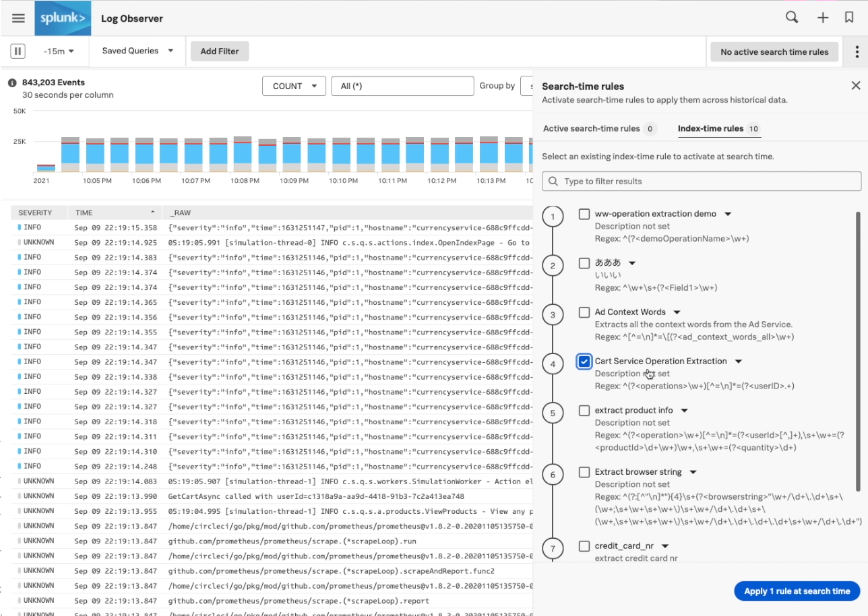
Search time rules
With search time rules you can transform the data that you see, for example through field extractions at read time without having to go through indexes.
And this is important for a couple of reasons:
- You can do transformations or extractions for you only, without changing it for everybody else.
- When you decide to transfer your data at index time, you can still see the impact of that transformation on historical data from before you made your indexing change.
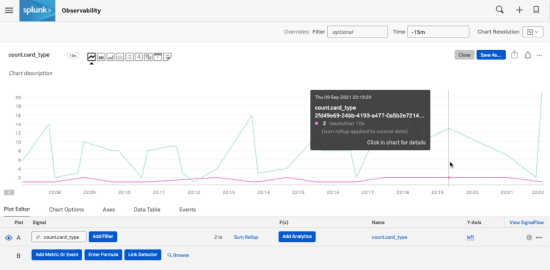
Saving your analysis
You can save any analysis in case the problem happens again. Saved queries can be loaded later, and you can choose to save the query for you alone or for everyone.
Another way to save the analysis and the data that you're displaying is turning logs queries into metrics and looking at them with Splunk Infrastructure Monitoring. Metrics you create in this way work just like any other metric - they contain metadata and you can can alert on them if needed.