Bringing alerts from Prometheus Alertmanager into ITSI episodes
Prometheus is a popular open-source tool used by many companies for monitoring their platforms and services. While it excels at collecting metrics and generating alerts, it lacks the ability to visualize metric and alert data or to correlate metrics and alerts with other sources.
This article shows you how to integrate Prometheus Alertmanager alerts into Splunk ITSI (ITSI) for efficient management, allowing you to correlate traditional alerting with service-centric views.
In this example, Prometheus is collecting metrics from a Linux estate. These metrics (e.g. CPU, Memory) drive alerting for the infrastructure. You would like to bring any open alerts into ITSI as episodes so you can manage these alerts from the same place as you monitor your services. In addition, you would like to know if one of your services has an open episode.
- An overview of Prometheus and its functionality, as well as installation and configuration guidance is beyond the scope of this document, but if you want to learn more about some of the configuration mentioned in the steps below, read the official Prometheus documentation.
- This example assumes that you have configured Alertmanager itself and Prometheus to send to Alertmanager. Details on these steps can be found in the Prometheus documentation.
Prometheus configuration
While the focus of this article is to provide a general approach for getting data into ITSI and configuring it to enable the integration, this section shows a simple Prometheus configuration to allow you to understand the high-level steps involved in the overall process.
Prometheus generally uses a pull-based mechanism for collecting metrics. It “scrapes” targets at set intervals to collect the metrics they provide and stores them. Targets in this sense are generally (but not always) small programs called exporters running on hosts that publish their metrics on an http endpoint. Those http endpoints are called "scrape targets".
Prometheus also has a bolt-on tool called Alertmanager. Rules are created on Prometheus to evaluate metrics (for example, disk space > 80%) and if there is a breach, they are sent on to Alertmanager for processing.
The diagram below shows the Prometheus architecture. The example used in this article concerns the “Prometheus server” box and the “Prometheus targets” along with the “Alertmanager”.
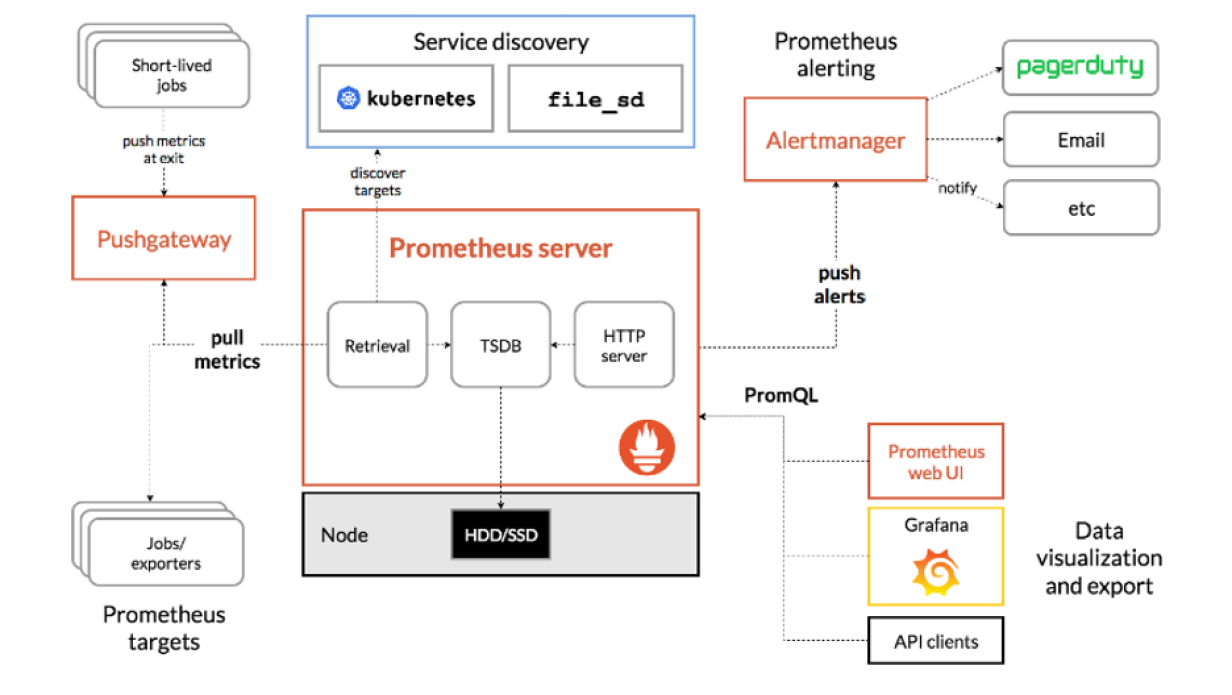
The example in this article uses alerting when a scrape target is down. This means Prometheus cannot connect to the instance to collect metrics, either because the exporter is down or, more seriously, the whole host is down.
The next sections of this article show the Prometheus configuration required to generate an alert in Alertmanager stating that a scrape target is no longer responding.
Defining the scrape target
Add the following configuration to the Prometheus configuration file, adjusting the variables to fit your environment.
scrape_configs:
 # The job name is added as a label `job=<job_name>` to any timeseries scraped from this config.
 - job_name: 'node_exporter'
static_configs:
 - targets: ['adalton-ds2:9100']
This tells Prometheus to scrape the host adalton-ds2 on port 9100. The job name is called node_exporter. The node_exporter has already been installed and is serving up metrics on the http port 9100.
Defining the alert
Define the alert in Prometheus. The alert rule below is written in the Prometheus query language, PromQL, and determines whether the scrape target is available or not.
groups:
- name: AllInstances
  rules:
  - alert: InstanceDown
    expr: up == 0
    for: 1m
    annotations:
      title: 'Instance {{ $labels.instance }} down'
      description: '{{ $labels.instance }} of job {{ $labels.job }} has been down for more than one minute'
    labels:
      severity: 'critical'
Now you have an alert that will be sent to Alertmanager. Next you need to get those alerts into ITSI using the HTTP Event Collector.
Splunk platform configuration
The Splunk platform requires an HTTP Event Collector token, and, ideally, a new index. For the purposes of this example, assume you have created a new index called “prometheus” and a new HTTP Event Collector token also called “prometheus”, setting a source type of prometheus, that has supplied the following token:
277dc2d6-29f9-4f26-9ccf-2c5032d7f632
Alertmanager configuration
Configure Alertmanager to send status events to the Splunk platform. You can do this by updating its main configuration file with a block similar to this:
route:
 group_by: ['alertname']
 group_wait: 10s
 group_interval: 10s
 repeat_interval: 1m
 receiver: 'splunk'
receivers:
 - name: 'splunk'
  webhook_configs:
  - url: 'http://10.202.5.112:8088/services/collector/raw?channel=00872DC6-AC83-4EDE-8AFE-8413C3825C4C'
  send_resolved: true
  http_config:
   tls_config:
    insecure_skip_verify: true
   basic_auth:
    username: Splunk
    password: 277dc2d6-29f9-4f26-9ccf-2c5032d7f632
There is no official integration from Prometheus to the Splunk platform, so this process uses Prometheus’ generic webhook config.
A repeat_interval of 1m is specified. This tells Alertmanager to send status alerts each minute if there is an open alert. Status changes (Up to Down, Down to Up, etc.) will be sent immediately. You want a constant flow of status when an alert has fired to enable you to craft your ITSI search later.
You’ll notice the url config item is a URL specifying the HTTP Event Collector. Use of the raw endpoint is required for the Prometheus events. If you use the raw endpoint, you must specify a channel.
The basic_auth section is the usual authentication headers passed to the HTTP Event Collector. The password is the HTTP Event Collector token created in the previous section.
Full details on specific configuration options for Alertmanager can be found in the Prometheus docs.
Configuration in ITSI
You now need to configure ITSI to handle the alert data, create distinct episodes from that data, and apply any rules necessary to manage the episode.
In this example, if no new alert data is received, ITSI automatically closes the episode. Alertmanager sends repeated alerts every minute when there is an active alert. If no such data is received within this timeframe, ITSI assumes the issue has been resolved and closes the corresponding episode.
Configuring the correlation search
In order to create an episode, ITSI requires a correlation search to be created. The output of a correlation search creates a notable event. Notable events can then be grouped into episodes via Notable Event Aggregation Policies (NEAPs).
Follow the steps below to set up a correlation search that every 5 minutes searches the Prometheus index for any alert that has a groupKey containing “InstanceDown” with a status of “firing”. This is the name of the alert created in the Defining the alert. The correlation search will also:
- Set a field (host_entity) containing an instance name that will match an already discovered ITSI entity (in this case adalton-ds2)
- Create a meaningful, unique alert_description field that ITSI will use to find out unique events
- Manually set an ITSI severity level field (severity) and set it to ITSI severity 6 (Critical)
For full information on configuring a correlation search, see Splunk Docs.
- Look at the event data generated by Alertmanager in order to craft your search. For each open alert, Alertmanager will send a JSON payload that looks something like this:
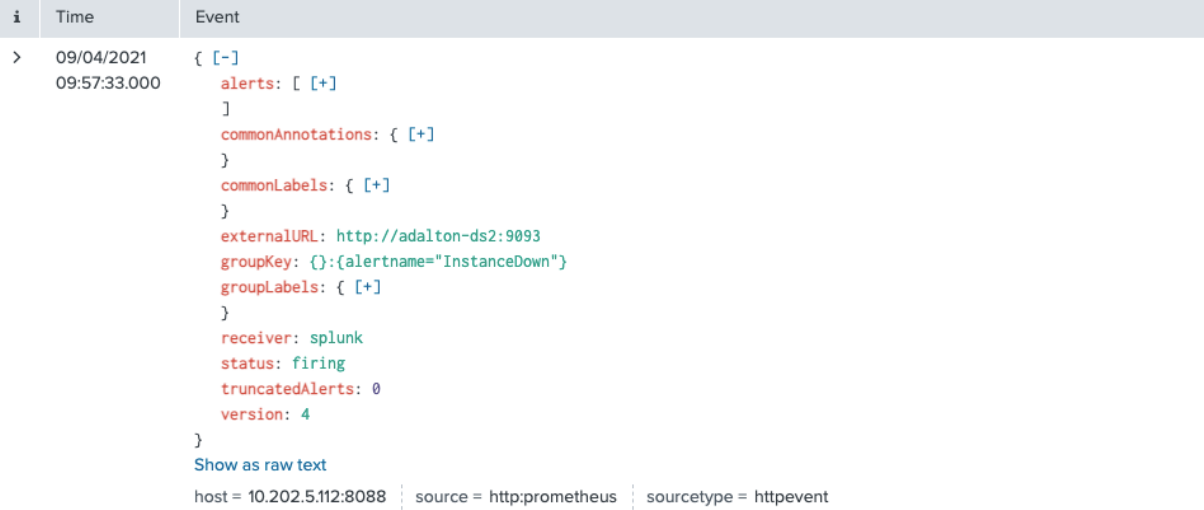
The raw text of the payload looks like this:
{"receiver":"splunk","status":"firing","alerts":[{"status":"firing","la bels":{"alertname":"InstanceDown","instance":"adalton-ds2:9100","job":" node_exporter","severity":"critical"},"annotations":{"description":"ada lton-ds2:9100 of job node_exporter has been down for more than one minute","title":"Instance adalton-ds2:9100 down"},"startsAt":"2021-04-09T13:57:23.952Z","endsAt":"0001-01-01T00:00 :00Z","generatorURL":"http://adalton-ds2:9090/graph?g0.expr=up+%3D%3D+0 \u0026g0.tab=1","fingerprint":"3fd82a5efb6f3b1e"}],"groupLabels":{"aler tname":"InstanceDown"},"commonLabels":{"alertname":"InstanceDown","inst ance":"adalton-ds2:9100","job":"node_exporter","severity":"critical"}," commonAnnotations":{"description":"adalton-ds2:9100 of job node_exporter has been down for more than one minute","title":"Instance adalton-ds2:9100 down"},"externalURL":"http://adalton-ds2:9093","version":"4","groupKey" :"{}:{alertname=\"InstanceDown\"}","truncatedAlerts":0} - Navigate to ITSI > Configuration > Correlation Searches.
- Under Search Properties, paste in the following SPL, changing the IP address in the instruction field to your own IP or Alertmanager host name.
index=prometheus groupKey=*InstanceDown* alerts{}.status=firing
| sort 0 - _time
| stats list(*) BY _time
| mvexpand list(alerts{}.annotations.description)
| rename list(alerts{}.annotations.description) AS alert_description
| rex field=alert_description "^(?<instance>.+\:.+)\s.+job\s(?<job_name>.+)\sha.+" |
eval host_entity=mvindex(split(instance,":"),0)
| fields alert_description, instance, host_entity, job_name, list(alerts{}.labels.severity)
| rename list(alerts{}.labels.severity) AS alert_severity
| eval severity=6, status=0, description="A Prometheus scrape instance is down: " . instance . " job name: " . job_name, instruction="Check alertmanager at
http://10.202.33.172:9093/#/alerts?silenced=false&inhibited=false&active=true& filter=%7Balertname%3D%22InstanceDown%22%7D",
event_source="prometheus"
| fields - alert_severity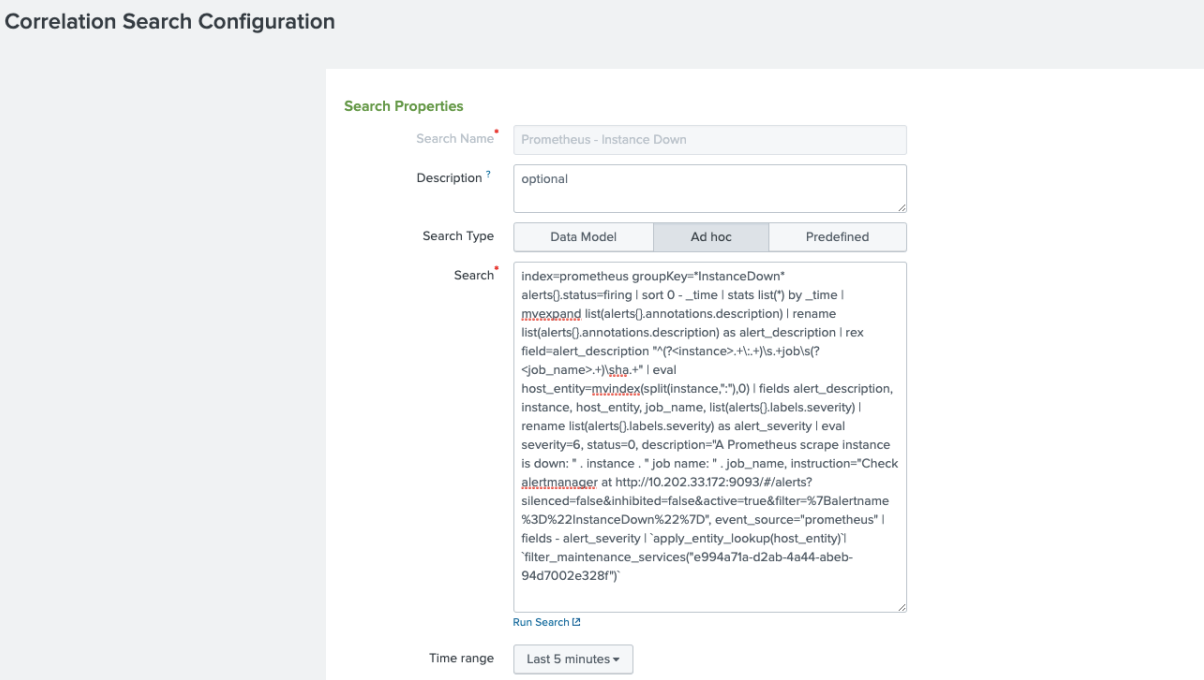
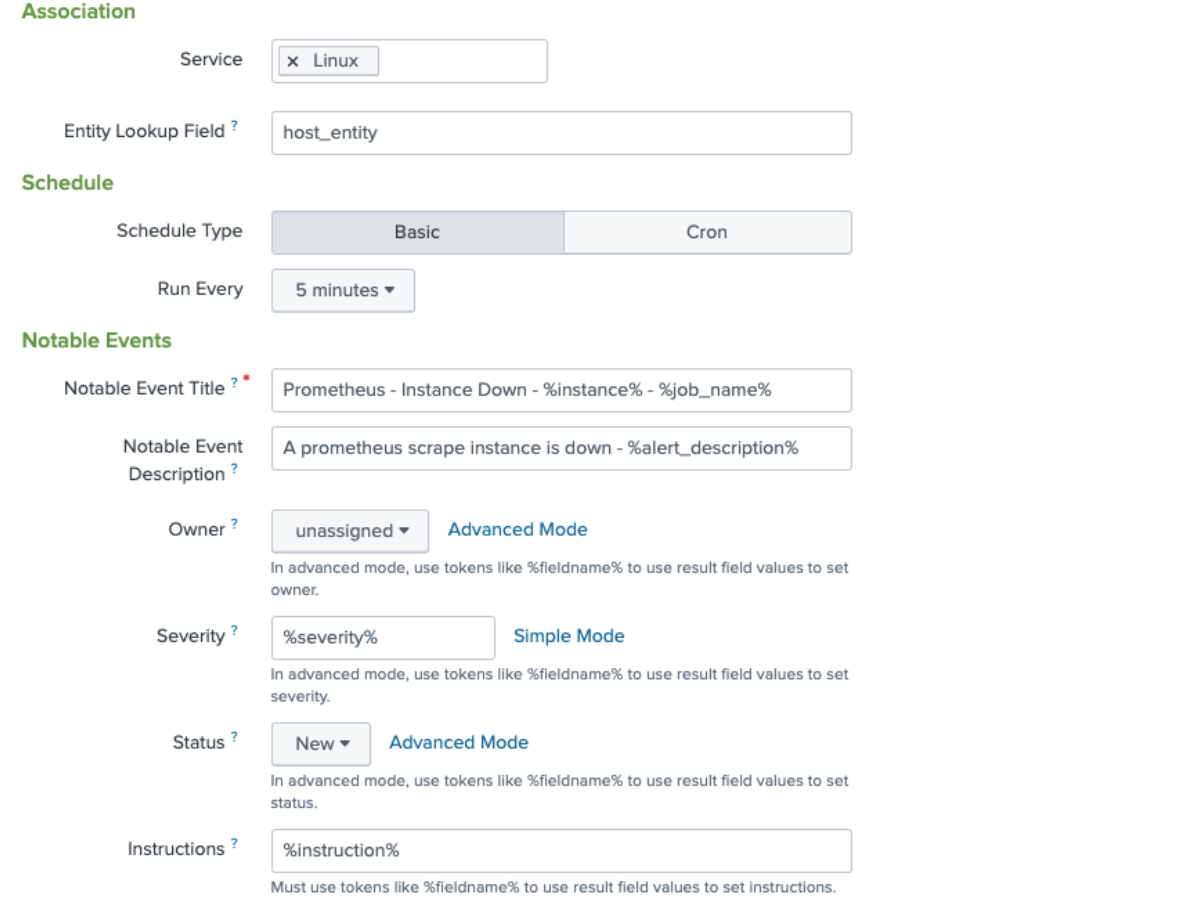
- On the next screen, configure the following fields:
- In the Association section:
- If you have a service you want to associate this correlation search with then add the service here. In this instance it has been added to a service called “Linux”. Associating to a service is optional.
- If you have a service and if you have configured ITSI to discover entities, associate the field host_entity field with an entity in ITSI. This field is an evaluated field in the search SPL you added in the previous step, used to manipulate a Prometheus label in order to match an ITSI entity.
- In the Schedule section, set the search Run Every field to the last 5 minutes.
- In the Notable Events section,
- Specify the ITSI Severity field. This is another evaluated field in the search SPL you added in the previous step.
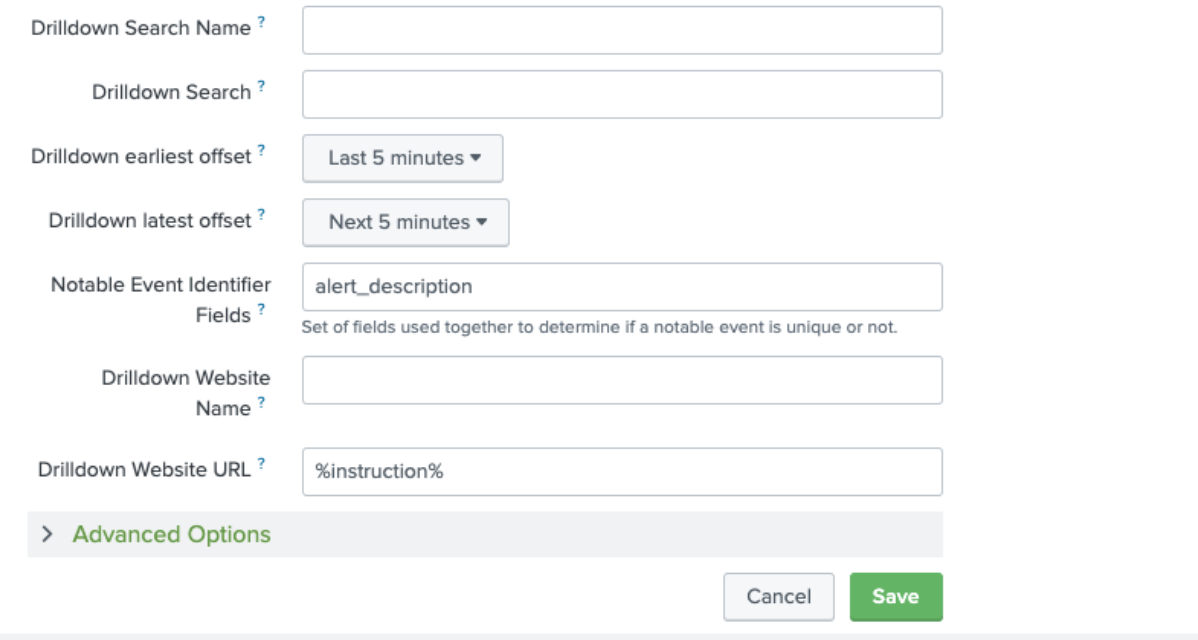
- Create a field that links the user back to the Prometheus Alertmanager for extra information. This URL is displayed in ITSI to help users to troubleshoot an episode.
- Set the Notable Event Identifier Fields to tell ITSI the field to use to find out whether a notable event is unique or not. In this example, the alert_description field is used, since you'll want to group alerts of the same type from the same host. All this detail is in the alert_description field so you can be sure that unique notable events will be created for each host.
- Complete all of the other fields as per this screenshot:
- In the Association section:
Creating the Notable Event Aggregation Policy (NEAP)
Now you have created notable events, you need to tell ITSI how to handle those events and apply sensible correlation in order to aid operations staff who are managing the events. The rules applied by the NEAP create ITSI episodes.
- Navigate to ITSI > Configuration > Notable Event Aggregation Policies.
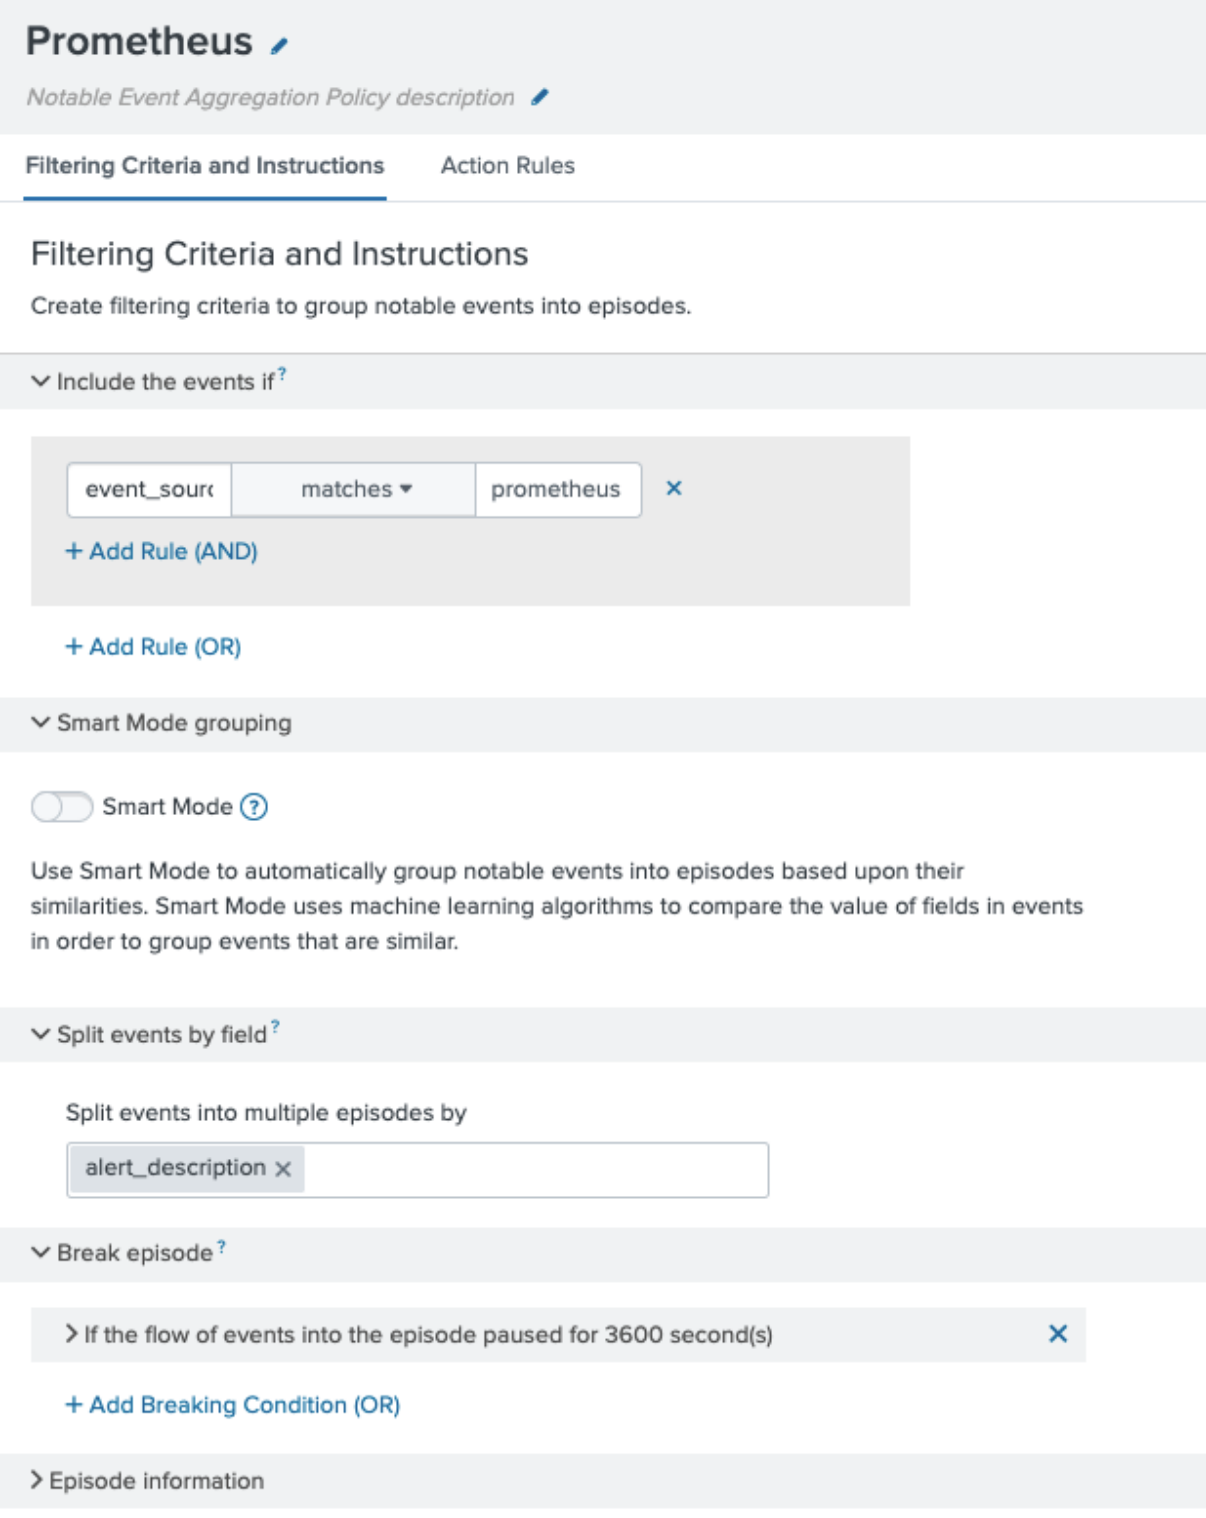
- Set the following filtering criteria for your NEAP:
- In the Include the events if section, set it to matches prometheus.
- In the Split events by field section, enter alert_description so you will get separate episodes if the alert fires on different hosts.
- In the Break episode section, set the episode to break if there has been a pause of 6 minutes (3,600 seconds). Because Alertmanager sends a status for open alerts every minute, if you haven’t received a status in 6 minutes, you can assume that episode is over. Be aware that breaking an episode is not the same as closing an episode. Breaking an episode means that if notable events start coming in 6 minutes after the last matching notable event, a new episode is created.
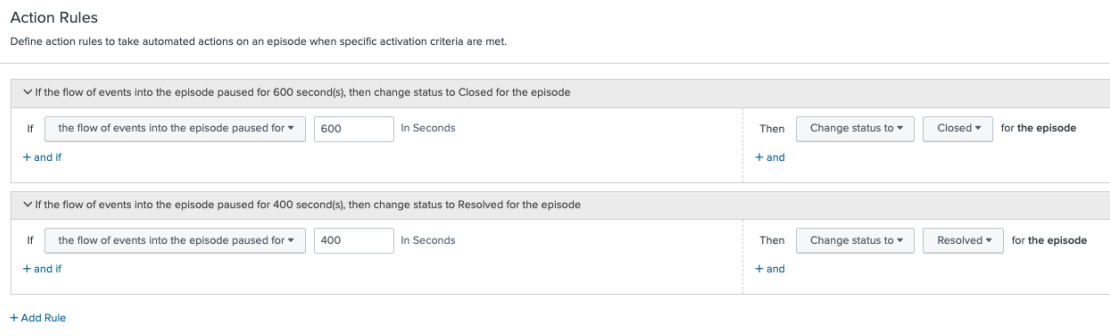
- Set action rules to tell ITSI how to handle the episode, including any automation you may want to run.
- Change the status of the episode to "closed" if you don’t receive any notable events for 600 seconds.
- Change the status of the episode to "resolved" if you don’t receive any notable events for 400 seconds.
Viewing the episodes
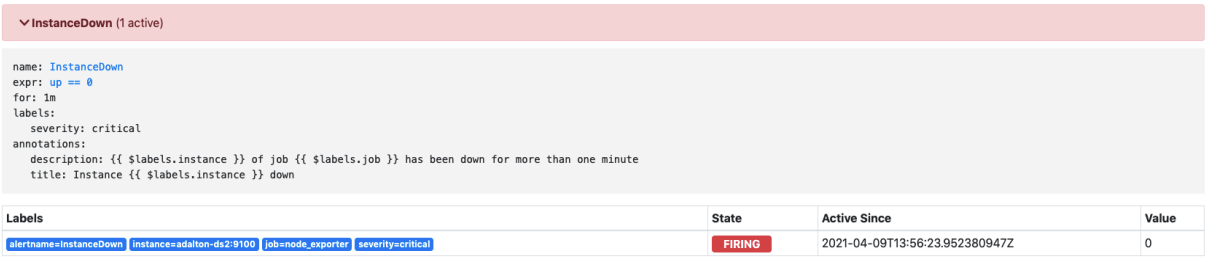
The node_exporter process has been manually stopped from firing on the scrape target. You should now see an alert fire on Prometheus and the alert forwarded to Alertmanager, which will in turn sends open alert data to the Splunk platform.
This is a screenshot of the alert firing on Prometheus:
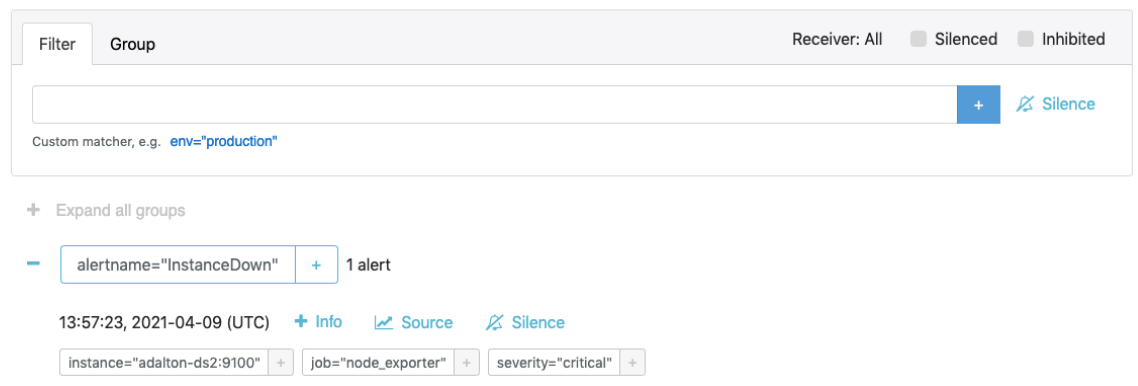
This is a screenshot of the alert received in Alertmanager:
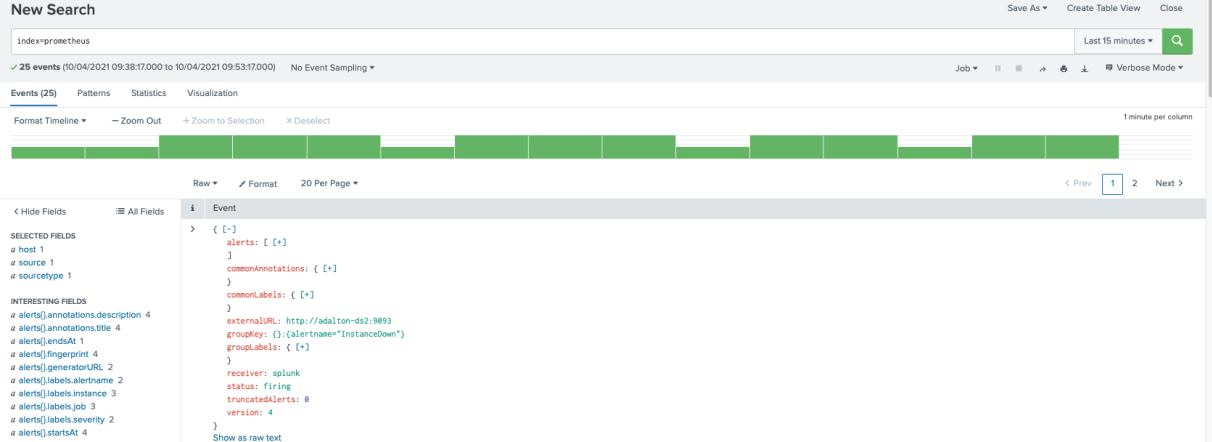
This is a screenshot of the alert event being received in the Splunk platform:
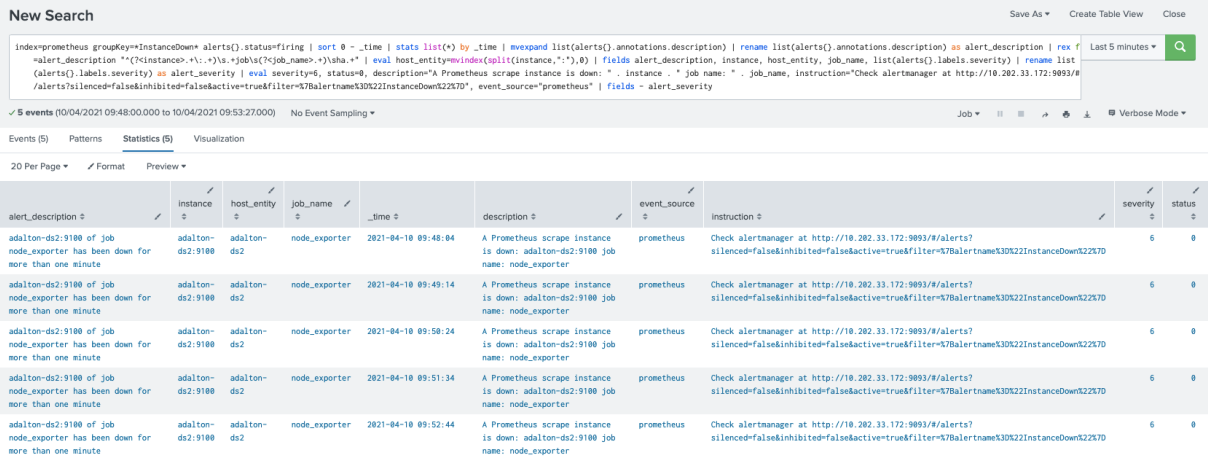
This screenshot shows the correlation search output:
This screenshot shows the corresponding episode on ITSI:
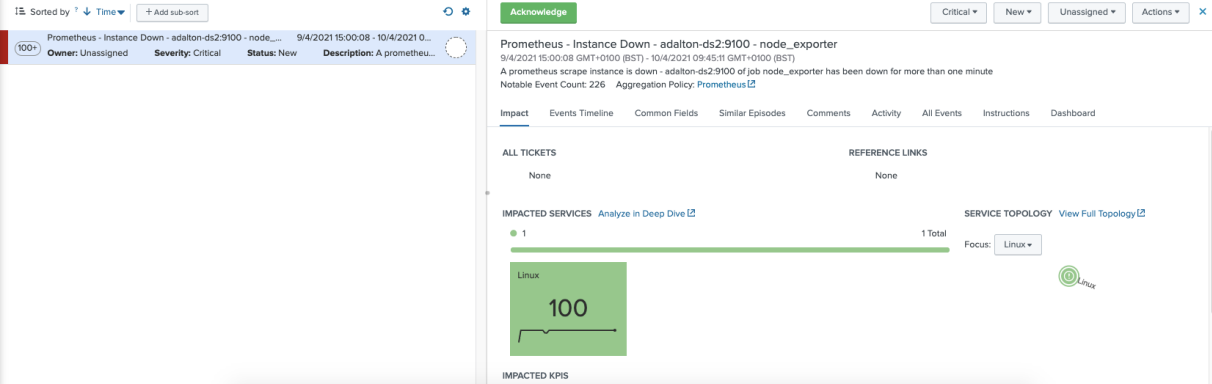
You’ll notice the corresponding service has also been highlighted in the drilldown. You’ll also see that the episode is not contributing negatively to the service health but is indicated with an exclamation mark in the service view in the Service Analyzer:
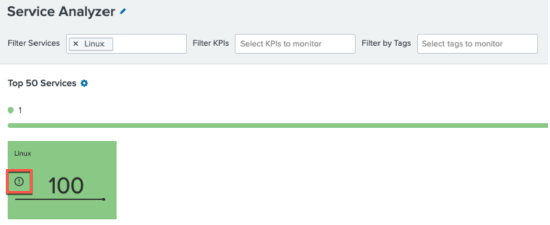
It is possible to have episodes contribute to service health score, but that configuration is out of scope for this article.
In Episode Review, click Add Filter > Policy followed by the NEAP policy you created (in this case, the one named “Prometheus”) to see the episodes that are being controlled by that policy:
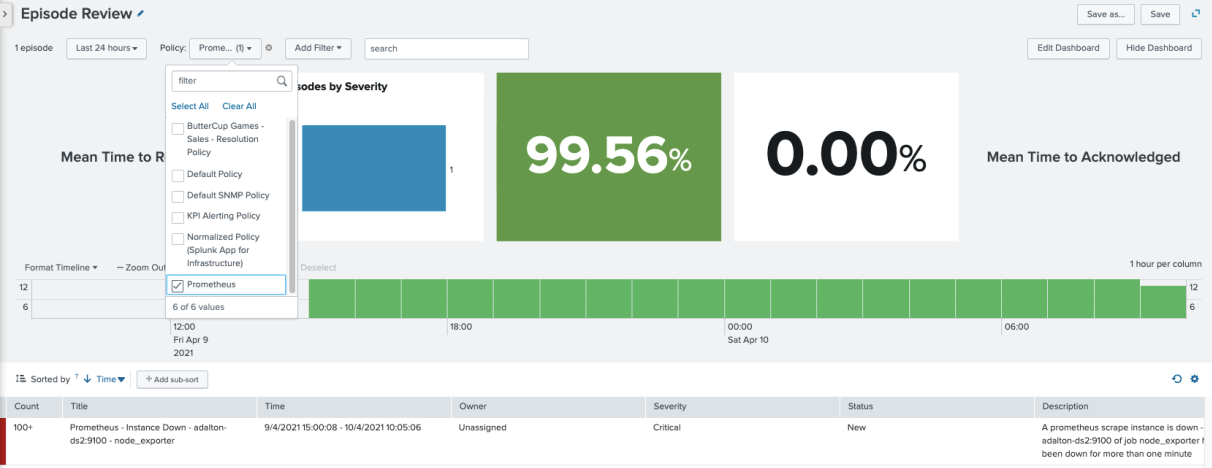
The policy you created has the correct filtering applied to include your alert. This means that after you restart the node_exporter component, the policy should resolve the episode after 400 seconds, and then close the episode after 600 seconds.
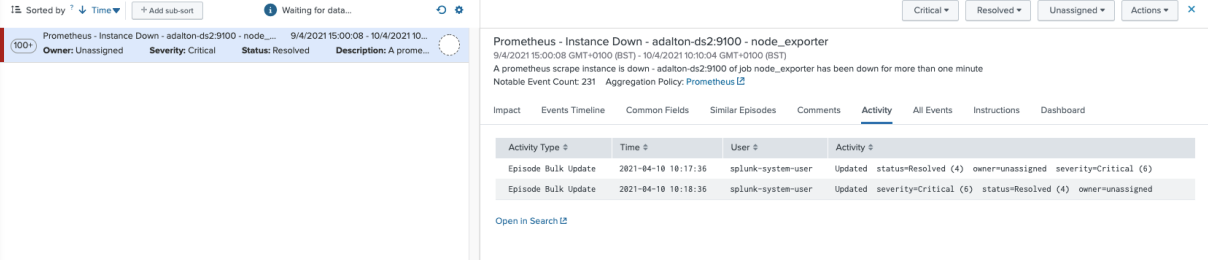
Click on the episode, and then click Activity to see the policy updating the episode to "resolved" after 400 seconds:
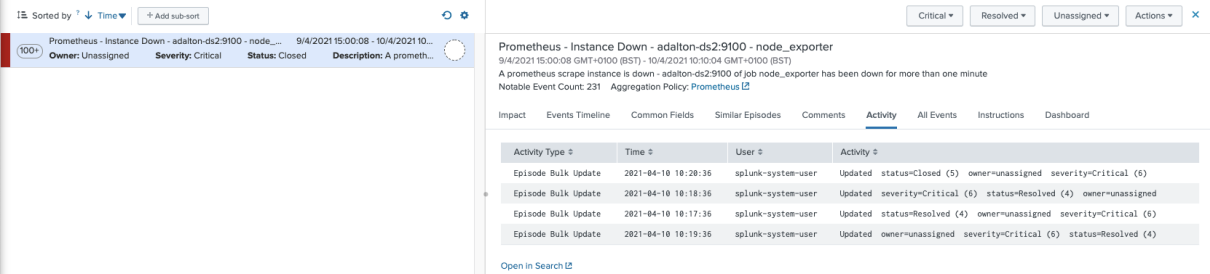
And finally, the closure after 600 seconds:
Next steps
Using ITSI in this way to manage alerts from disparate monitoring and observability sources can be incredibly powerful for operations.
In addition to being able to automatically group alerts any way you choose - to ensure operations teams remain focused on issues that matter - ITSI makes it easy to apply automation and correlate alerting with business services, giving operations teams a holistic view of their important services, from infrastructure right through to business KPIs.