Optimizing dashboards with post-process searches
In many Splunk dashboards, the same search is run multiple times, showing different types of graphs or with slight variations (for example, one graph showing “allowed” and another showing “blocked”). This creates more overhead every time the dashboard is opened or refreshed, causing the dashboard to open or populate more slowly and increasing demand on infrastructure.
You can save search resources by creating a base search for the dashboard. Panels in the dashboard use a post-process search that can be added in the Simple XML of the dashboard to further modify the results of a base search.
With proper optimization techniques, a full typical dashboard with 10 panels can run fewer than three Splunk searches, versus the 10 individual searches that would normally run.
Creating your base search with transformed event data
Searches in Splunk Enterprise can return raw event data or transformed event data.
It's not ideal to have your base search return raw events. If the base search is a non-transforming search, only the first 500,000 events are returned and any results in excess of this will be truncated, resulting in incomplete data for the post-process search.
Because of this, a best practice for base searches is to always use transforming commands and refine your search as much as possible. The primary transforming commands are:
charttimecharttoprarestats
For more information about the limitations of post-process searches, read Post-process searches (in Enterprise or Cloud).
Designing your base and post-process searches
One method of determining what should be the base search and what should be in each post-process search is to create all of the searches for your dashboard first, and then find the commonality between the searches which will end up being your base search. The part that the searches do not have in common will be the post-process search.
If you have four searches and three have a commonality but the fourth is completely different, you can do the base search for the three common Splunk searches and the fourth will just run as a normal search.
Here are five example searches that we want to include in a dashboard. If you ran these searches in your dashboard it would run five almost identical searches, taking up valuable search resources and user limits.
sourcetype="pan:threat" action=allowed | stats count BY appsourcetype="pan:threat" action=allowed | stats count BY rulesourcetype="pan:threat" action=allowed | stats count BY categorysourcetype="pan:threat" action=allowed | stats count BY signaturesourcetype="pan:threat" action=allowed | stats count, values(rule) AS rule BY dest_ip
The commonality of the 5 searches is sourcetype=”pan:threat” action=allowed |. However, if you use that portion as your base search, it will return raw results. Instead, make this into a transforming search:
sourcetype="pan:threat" action=allowed
| stats count BY app, rule, category, signature, dest_ip, src_ip
Your base search plus the post-processing searches should then look like this:
| Search type | Search |
|---|---|
| Base Search | sourcetype="pan:threat" action=allowed |
| Post-process 1 | | stats sum(count) AS count BY app |
| Post-process 2 | | stats sum(count) AS count BY rule |
| Post-process 3 | | stats sum(count) AS count BY category |
| Post-process 4 | | stats sum(count) AS count BY signature |
| Post-process 5 | | stats sum(count) AS count, values(rule) AS rule BY dest_ip |
Implementing your base and post-process searches in your dashboard
- Switch to the XML source view of the dashboard and start making your base search and post-process searches. Below is how the dashboard’s XML looks before using any post-process searches.
<

<panel>
<table>
<title>Applications</title>
<search>
<search>sourcetype=”pan:threat” action=allowed | stats count by app</search>
<earliest>-24h@h</earliest>
<latest>now</latest>
</search>
<option name=”drilldown”>none</option>
</table>
</panel>
<panel>
<table>
<title>Rule</title>
<search>
<search>sourcetype=”pan:threat” action=allowed | stats count by rule</search>
<earliest>-24h@h</earliest>
<latest>now</latest>
</search>
<option name=”drilldown”>none</option>
</table>
</panel>
<panel>
<table>
<title>Catergory</title>
<search>
<search>sourcetype=”pan:threat” action=allowed | stats count by category</search>
<earliest>-24h@h</earliest>
<latest>now</latest>
</search>
<option name=”drilldown”>none</option>
</table>
</panel>
</row>
<row>
<panel>
<table>
<title>Signature</title>
<search>
<search>sourcetype=”pan:threat” action=allowed | stats count by signature</search>
<earliest>-24h@h</earliest>
<latest>now</latest>
</search>
<option name=”drilldown”>none</option>
</table>
</panel>
<panel>
<table>
<title>Rules by Destination IP</title>
<search>
<search>sourcetype=”pan:threat” action=allowed | stats count, values(rule) as rule by dest_ip</search>
<earliest>-24h@h</earliest>
<latest>now</latest>
</search>
<option name=”drilldown”>none</option>
</table>
</panel>
</row>
</dashboard>
- In the XML Source view, add a base search id inside of the search tags at the top of the dashboard, under the label but before all of the panels, in the format
<search id=”{id name}”>. The id name must be in double quotes, and the name is case sensitive.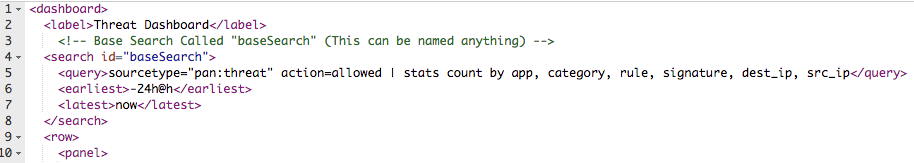
The base search id can be named anything (in this case it is “baseSearch”) but it is best to choose a simple name, as you will need to use it throughout the dashboard. The base search id is referenced in each post-process search, which appends the base search in front of each post-process search.
- Add the transforming base search search inside of the open and closed search tags, in the format
<search> {insert search here} </search>. - Add any other supported tags such as the timeframe tags including tokens created and assigned in the dashboard. Make sure you close the search tag with
</search. - Add the post-process searches to each of the panels on the dashboard.
- Like the base search, the post-process search uses the base search id in the search tags:
<search base=”{id name of base search}”>. - Add the search tags where the post-process search goes. This search should start with a pipe because it will be appended to the base search like it is all one search, e.g.
<search> “ {post-process search that start with a pipe “|” } </search>. - After the search tags, any other supported tags can be used. Ensure you close the search tag with
</search> - Ensure that any time references are removed, since the base search controls the timeframe.
- Like the base search, the post-process search uses the base search id in the search tags:
Your final XML should look like this:
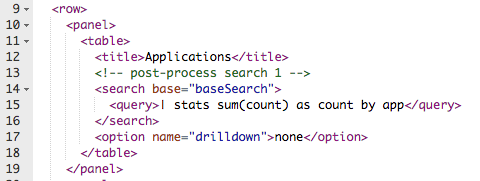
This is what the XML in the dashboard looks like after making the changes.
<dashboard>

<label>Threat Dashboard</label>
<!– Base Search Called “baseSearch” (This can be named anything) –>
<search id=”baseSearch”>
<search>sourcetype=”pan:threat” action=allowed | stats count by app, category, rule, signature, dest_ip, src_ip</search>
<earliest>-24h@h</earliest>
<latest>now</latest>
</search>
<row>
<panel>
<table>
<title>Applications</title>
<!– post-process search 1 –>
<search base=”baseSearch”>
<search>| stats sum(count) as count by app</search>
</search>
<option name=”drilldown”>none</option>
</table>
</panel>
<panel>
<table>
<title>Rule</title>
<!– post-process search 2 –>
<search base=”baseSearch”>
<search>| stats sum(count) as count by rule</search>
</search>
<option name=”drilldown”>none</option>
</table>
</panel>
<panel>
<table>
<title>Catergory</title>
<!– post-process search 3 –>
<search base=”baseSearch”>
<search>| stats sum(count) as count by category</search>
</search>
<option name=”drilldown”>none</option>
</table>
</panel>
</row>
<row>
<panel>
<table>
<title>Signature</title>
<!– post-process search 4 –>
<search base=”baseSearch”>
<search>| stats sum(count) as count by signature</search>
</search>
<option name=”drilldown”>none</option>
</table>
</panel>
<panel>
<table>
<title>Rules by Destination IP</title>
<!– post-process search 5 –>
<search base=”baseSearch”>
<search>| stats sum(count) as count, values(rule) as rule by dest_ip</search>
</search>
<option name=”drilldown”>none</option>
</table>
</panel>
</row>
</dashboard>
After you have modified all of the post-process searches in the XML source, the dashboard will be ready to use the base search. If you run the dashboard and look at the current searches, there will only be one search compared to several searches.
Next steps
This resource might help you understand and implement this guidance:
- Product tip: Following best practices for working with dashboards
Want to learn more about optimizing Splunk dashboards? Contact us today! TekStream accelerates clients’ digital transformation by navigating complex technology environments with a combination of technical expertise and staffing solutions. We guide clients’ decisions, quickly implement the right technologies with the right people, and keep them running for sustainable growth. Our battle-tested processes and methodology help companies with legacy systems get to the cloud faster, so they can be agile, reduce costs, and improve operational efficiencies. And with hundreds of deployments under our belt, we can guarantee on-time and on-budget project delivery. That’s why 97% of clients are repeat customers.
The user- and community-generated information, content, data, text, graphics, images, videos, documents and other materials made available on Splunk Lantern is Community Content as provided in the terms and conditions of the Splunk Website Terms of Use, and it should not be implied that Splunk warrants, recommends, endorses or approves of any of the Community Content, nor is Splunk responsible for the availability or accuracy of such. Splunk specifically disclaims any liability and any actions resulting from your use of any information provided on Splunk Lantern.