Getting started with Infrastructure Monitoring
Splunk Infrastructure Monitoring is part of Splunk Observability Cloud. To get started with Splunk Observability Cloud, first follow the instructions in the Splunk Docs topic, Set up and administer Splunk Observability Cloud. New users might also be interested in an overview of important terms and concepts, as well as the Splunk Education offerings for Splunk Infrastructure Monitoring.
To make the most of your investment in Splunk Infrastructure Monitoring, it’s important that you understand some core concepts and the value this product/technology aims to deliver.
What is Splunk Infrastructure Monitoring?
Splunk Infrastructure Monitoring is a real-time, analytics-driven multicloud monitoring solution. It allows you to create robust visualizations, and alert on your organization’s infrastructure metrics.
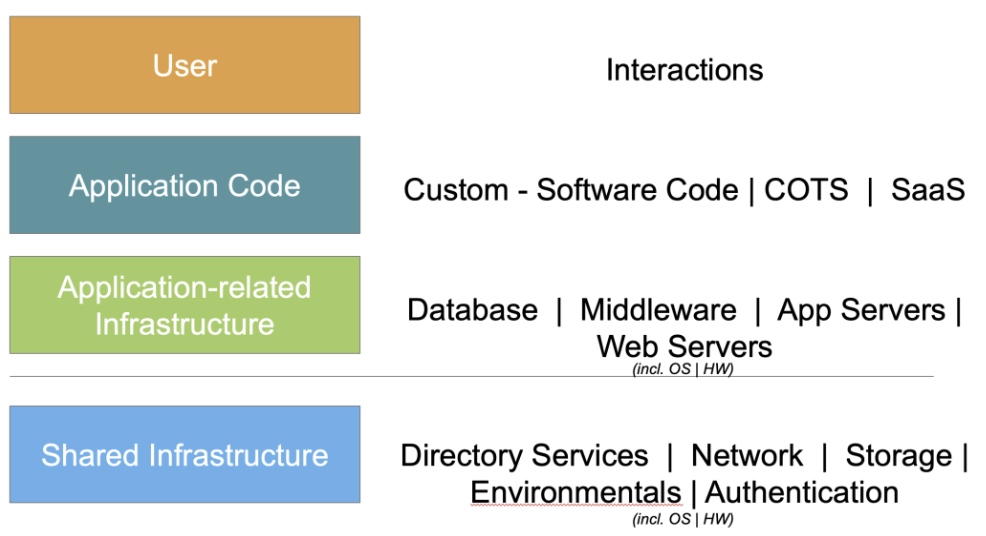
Splunk Infrastructure Monitoring addresses the monitoring of the lower parts of service stack. This includes elements such as servers, databases, container systems, app servers, or storage.
Monitoring these systems is critical to ensuring the applications that sit on top of them are available and performing well. An error in any one component can potentially negatively impact users. For example, if a server is running out of available memory, an end user trying to make a purchase on a web store that sits on top of that server could experience delays in response time.
These types of issues must be resolved quickly. The time it takes to detect and repair an issue is called Mean-Time-to-Repair (MTTR). A key goal of an organization's support team is to reduce the MTTR to such a level that the user’s impact is minimized or possibly avoided to begin with.
When an issue is detected with Splunk Infrastructure Monitoring, it triggers the incident management lifecycle. In addition to detecting an issue, Splunk Infrastructure Monitoring is also used in the investigation step of the incident management cycle. Splunk Infrastructure Monitoring might be a single part of a set of investigation tools you use depending on the issue - for example, you might also use Splunk ITSI.
The incident management lifecycle

What problems does Splunk Infrastructure Monitoring help solve?
Splunk Infrastructure Monitoring helps organizations stay on top of the health and performance of their technology infrastructure. Splunk Infrastructure Monitoring’s streaming architecture detects issues in real time, allowing for faster recovery and minimized impact on end user experience.
What are some business initiatives Splunk Infrastructure Monitoring ties into?
- Make the most of the benefits of cloud adoption.
- Meet elevated SLAs for availability and uptime, including real-time alerts.
- Real-time visibility fosters innovation.
How does it work?
Through integrations with cloud providers, and the deployment of an OpenTelemetry agent, Splunk Infrastructure Monitoring collects infrastructure data/metrics. The streaming analytics engine processes and analyzes the data for visualizations and alerting.
What does adoption of Splunk Infrastructure Monitoring look like?
Splunk Infrastructure Monitoring alerts customers, in real time, of any issues that may be occurring in their infrastructure. Splunk Infrastructure Monitoring helps customers answer the question “Do I have a problem?” and then alerts customers of the problem in real time via Splunk Infrastructure Monitoring's detectors, which are powered by streaming analytics.
For customers to adopt this product and gain value they must: send data into Splunk Infrastructure Monitoring via integrations/agents with cloud providers/services, create dashboards and visualizations to make sense of all their data, and then create detectors in order to be alerted on this data at the desired thresholds important to the customer’s use case(s).