Monitoring access to Operational Technology environments outside business hours
Operational Technology (OT) environments need to be supported 24/7, 365 days a year, but many activities should occur only during regular working hours. For many organizations, sites might be located across different time zones and locations, or comply with different local laws and regulations around working hours, meaning different locations might need different normal working hours. Monitoring activity after normal working hours with the ability to set different working hours for different locations can help identify unusual access to OT environments.
This use case focuses on access to Microsoft Windows-based systems, since they are the most common operating systems used in OT environments. There might also be a need to filter out certain accounts to eliminate expected activity (for example, activities associated with service accounts or support personnel). This filter can also be used to monitor specific kinds of access, such as access by contractors or vendors outside normal working hours.
Data required
- Windows security logs. In the examples in this article, event codes for login and log off authentication attempts are required (event codes 4624 and 4625, or, for older legacy systems, event code 528 and 529).
We recommend you use the Splunk Add-on for Microsoft Windows to manage your data for this use case.
How to use Splunk software for this use case
Stage 1: Ingest Windows security events indicating login activity
In this stage, you need to ensure that you are collecting Windows Security Events for specific event codes. You need to ensure you are receiving successful login attempts using event codes 4624, or 528 for legacy systems, and failed login attempts using event codes 4625, or 529 for legacy systems. If you want to limit this only to remote login activity you can add Login_Type=10 to the search below.
To verify that you are receiving these events, run the following search. You can optimize this by specifying an index and adjusting the time range.
source=WinEventLog:Security
((EventCode=4624 OR EventCode=528) OR (EventCode=4625 OR EventCode=529))
| eval action=CASE(EventCode=4624 OR EventCode=528, "Success", EventCode=4625 OR EventCode=529, "Failure")
Search explanation
The table provides an explanation of what each part of this search does. You can adjust this search based on the specifics of your environment.
| Splunk search | Explanation |
|---|---|
source=WinEventLog:Security |
Search Windows security events. |
((EventCode=4624 OR EventCode=528) OR (EventCode=4625 OR EventCode=529)) |
Search for Windows event codes 4624 and 528 (successful logins) and event Codes 4625 and 529 (failed logins). |
| eval action=CASE(EventCode=4624 OR EventCode=528, "Success", EventCode=4625 OR EventCode=529, "Failure") |
Label the action as either successful login or failed login. |
Stage 2: Identify regular working hours for each asset
A lookup file for regular working hours by asset will be needed to reflect normal working hours per location. The example search in stage 4 uses a lookup table named work_hours_by_asset. The lookup file should contain the following columns:
dest: the asset name, or wildcard match for the asset nameday_start_hour: the local hour the work day startsday_start_minute: the minute the work day startsday_end_hour: the local hour the work day endsday_end_minute: the minute the day endsgm_offset: time offset from UTC time (for localization)
As noted, the day start and end hours are in local time. So for instance if the normal working day is 8am to 5pm, you would use 8 as the day_start_hour and 5 as the day_end_hour. You then specify the offset from UTC so that any queries adjust for the time when performing the search.
Asset names could also be used to accept a wildcard for matching. For instance, if you have a set of assets that all start with GCC_ and also are located in the same time zone, you can use GCC_* to set the normal working hours for those assets.
Stage 3: Identify accounts to be monitored
Next, we will create the lookup file that shows accounts that should be excluded or included for monitoring. This means you can specify certain accounts or exclude certain accounts from this report. In the example below, the lookup file name exclude_users_from_reports is used. The lookup file should contain the following fields:
user: the user name, or wildcard match for the user nameis_excluded: TRUE to exclude the user from reports and FALSE to include them
This lookup file can be modified to take an explicit include (allowlist) or exclude (denylist). For example, by default, all accounts could be included as a last entry in the lookup file for all users with a false exclusion. Changing this to TRUE excludes all users not explicitly listed above.
In this lookup, matches begin at the top of the lookup and only match the first match. As a result, when using this method, entries either explicitly including or excluding should always be the last entries in the lookup file.
Stage 4: Verify the search for activity
In this stage, we will verify the base search runs and returns results. To verify this, run the following search:
source=WinEventLog:Security ((EventCode=4624 OR EventCode=528) OR (EventCode=4625 OR EventCode=529)) user="*" dest="*"
| eval action=CASE(EventCode=4624 OR EventCode=528, "Success", EventCode=4625 OR EventCode=529, "Failure")
| lookup work_hours_by_asset dest OUTPUTNEW gm_offset,day_start_hour,day_end_hour
| lookup exclude_users_from_reports user OUTPUTNEW is_excluded
| eval timeInTimeZone=_time - (gm_offset * 60 * 60)
| eval hourInTimeZone=strftime(timeInTimeZone,"%H")
| where (hourInTimeZone < day_start_hour OR hourInTimeZone >= day_end_hour) AND is_excluded="FALSE"
Search explanation
The table provides an explanation of what each part of this search does. You can adjust this search based on the specifics of your environment. It might be necessary to modify the last line of the search to verify that any results are being sent. For example, if there were no after-work hour login events in the last 24 hours you might want to modify the search or expand the time range.
| Splunk search | Explanation |
|---|---|
source=WinEventLog:Security |
Search Windows security events. |
((EventCode=4624 OR EventCode=528) OR (EventCode=4625 OR EventCode=529)) |
Search for Windows event codes 4624 and 528 (successful logins) and event Codes 4625 and 529 (failed logins). |
| eval action=CASE(EventCode=4624 OR EventCode=528, "Success", EventCode=4625 OR EventCode=529, "Failure") |
Label the action as either a successful or failed login. |
| lookup work_hours_by_asset dest OUTPUTNEW gm_offset,day_start_hour,day_end_hour |
Look up the local work hours for the asset. |
| lookup exclude_users_from_reports user OUTPUTNEW is_excluded |
Look up whether the user should be included or excluded. |
| eval timeInTimeZone=_time - (gm_offset * 60 * 60) |
Convert the time to the local time zone. |
| where (hourInTimeZone < day_start_hour OR hourInTimeZone >= day_end_hour) AND is_excluded="FALSE" |
Only find results if they are before the start of day and after the end of day. We also exclude users who are labeled as excluded. |
Next steps
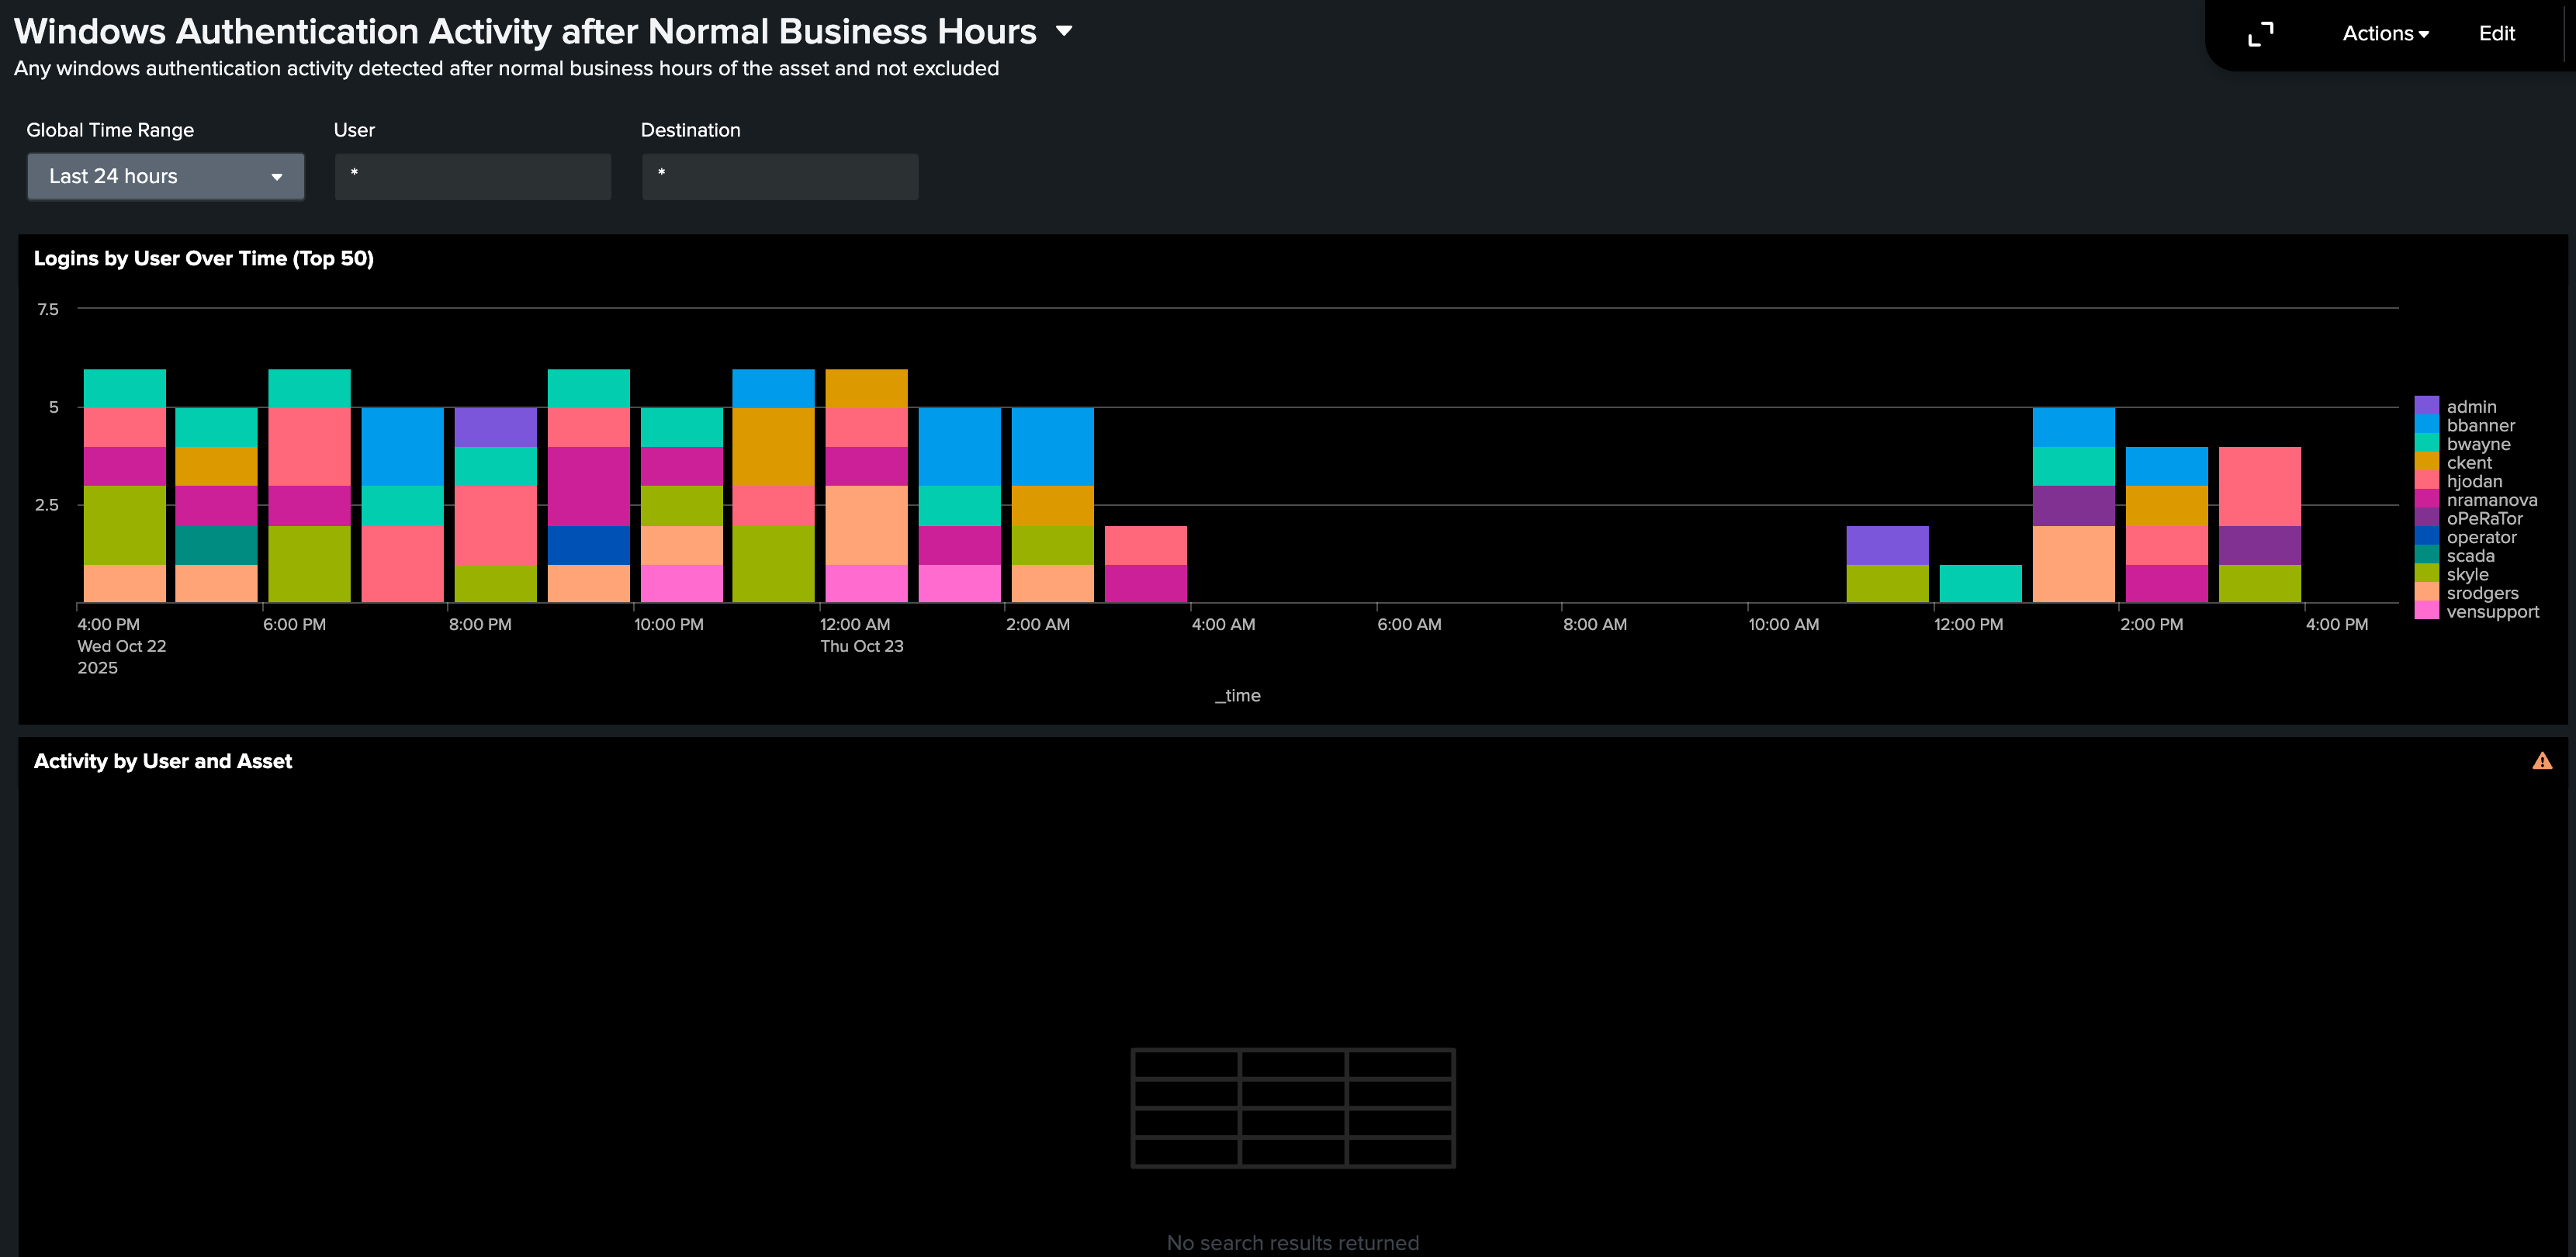
You can automatically generate and email this report to members of your security teams on a periodic basis. You might also want to only include remote logins or logins to other types of assets such as routers, switches, firewalls, or Linux machines. Leveraging the CIM Authentication Data Model can help you identify this activity across different types of assets. An example dashboard that could be created from this data is shown below.