Monitoring contact center operations with Splunk ITSI
Many large organizations operate complex contact center networks, often with a mix of on-premises and cloud technologies such as Genesys, Alvaria, and various Telco providers. Such complex networks can, however, bring significant challenges in maintaining operational agility. Engineers and IT staff often rely on reactive troubleshooting, sifting through disparate log files with varying data formats and PII that requires privileged access. This manual process often results in high Mean Time to Repair (MTTR) and difficulty pinpointing the root cause of issues that affect the customer experience.
With Splunk ITSI, you can transform call center and contact center operations from reactive to proactive by creating a single, searchable view of logs and metrics, enabling you to detect issues before they impact customers. This article shows you how to achieve this end-to-end visibility.
How to use Splunk software for this use case
The following steps outline the journey to building a comprehensive contact center monitoring solution using Splunk ITSI.
1. Ingest and secure critical data
The first step is to identify and ingest logs from your most critical applications. For a contact center, this typically includes:
- Core telephony: For example Genesys, Avaya, or Cisco logs.
- Infrastructure: Session Border Controllers (SBCs) and IVR systems.
- Agent tools: Desktop application logs and workforce management systems (such as Alvaria).
One of the primary hurdles in contact center operations is appropriately handling PII within log files. Traditionally, accessing these logs requires privileged access controls, slowing down investigations. By ingesting this data into the Splunk platform, you can mask sensitive fields (like customer names or full account numbers) at ingestion time while retaining the critical metadata needed for troubleshooting, such as call IDs or timestamps. This democratizes data access for your engineering teams without compromising security compliance. You can check the use cases in the PII data type category to find several ways to do this.
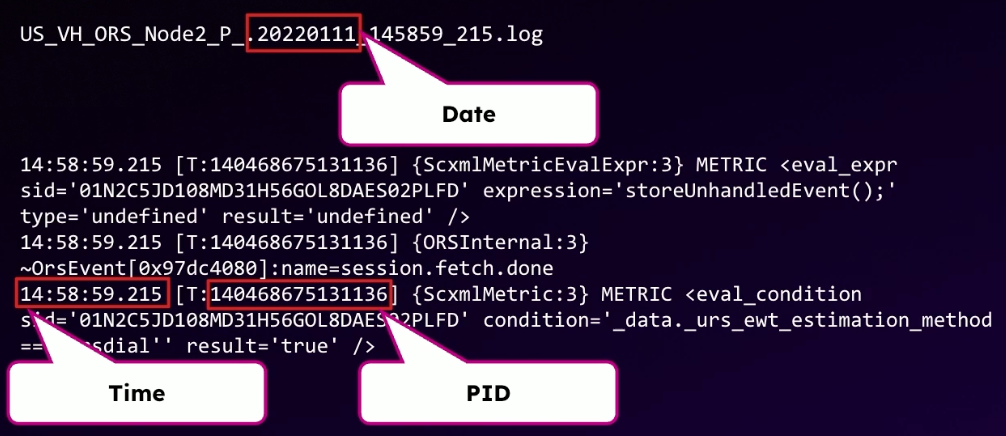
You can also leverage the "schema on read" capabilities of the Splunk platform to ingest machine data quickly without upfront data modeling. This allows you to search and analyze logs immediately. The screenshot below shows an example of key information in a machine-generated log file that can be searched and extracted, simplifying further analysis.
2. Build an end-to-end service view
After the data is available, use the Service Analyzer in Splunk ITSI to map the entire service journey. A contact center interaction is not just a single event; it is a chain of dependencies starting from the Telco provider, passing through the SBC and IVR, and finally reaching an agent. The screenshot below shows an example of the Service Analyzer illustrating this service chain.

To create a complete picture, integrate data from other observability tools you might already use, such as:
- Application Performance Monitoring (APM): Tools like Splunk Application Performance Monitoring or AppDynamics monitor the application stack.
- Network Monitoring: Tools like ThousandEyes visualize network paths and connectivity.
- Synthetic Monitoring: Tools like VoiceWatch simulate customer calls and verify connectivity.
By correlating these data sources in the Service Analyzer, you can visualize the health of the entire stack in one place. This "single pane of glass" allows you to drill down from a high-level service health score to the specific host or log file that is causing an issue.
3. Implement and refine alerting
Effective alerting is crucial for reducing noise and focusing on genuine incidents. Start by establishing baseline thresholds for your KPIs. You might initially rely on trial and error to find the right static thresholds for metrics like "calls in queue" or "failed transfers."
As your implementation matures, move to adaptive thresholding in Splunk ITSI. Contact center traffic is highly cyclical, with volumes varying significantly by time of day and day of week. Adaptive thresholds use machine learning to analyze historical data and dynamically adjust alert triggers, ensuring you are alerted to anomalies rather than expected spikes in traffic.
Additionally, implement automated health checks. For example, use synthetic transaction data to verify that critical numbers are reachable every 15 minutes. This provides an early warning system that can detect outages before real customers are affected.
4. Drive continuous improvement through post-incident reviews
Technology is only part of the solution; process plays a vital role. Adopt a strategy of continuous improvement by integrating Splunk ITSI into your post-incident review (PIR) process. After every major incident, ask your team: "Could we have detected this sooner?"
If the answer is yes, build a new specific use case or KPI into Splunk ITSI to cover that gap. This iterative approach ensures that your monitoring coverage expands with every incident, progressively reducing blind spots and building resilience into your operations.
Next steps
The journey to proactive monitoring involves more than just technology. Here are key takeaways to ensure a successful deployment:
- Prioritize candid communication: Maintain open and honest relationships with your account team and professional services. Regular communication allows for effective delivery and necessary course corrections during the project.
- Focus on data discovery: Avoid the temptation to ingest everything immediately without a plan. Spend time understanding your data and defining your use cases upfront. Knowing exactly what you want to measure allows you to define success accurately.
- Adapt your operating model: Implementing Splunk ITSI requires a shift in processes. You need a dedicated team to maintain the environment, tweak thresholds, and evolve use cases. It is not a "set it and forget it" tool; enabling your teams is just as important as the technology itself.
- Trust the contextualized view: An end-to-end view of your service journey is transformational. By correlating infrastructure data with user experience metrics, you gain a trustworthy baseline that directly correlates to improved service levels.
By implementing these strategies, you can achieve a unified view of your contact center, reduce MTTR, and improve customer satisfaction. To further enhance your implementation, consider the following:
- Glass tables: Create high-level glass tables for executive stakeholders to visualize business-critical metrics alongside technical health.
- Predictive analytics: Explore predictive analytics in Splunk ITSI to forecast potential outages based on historical trends.
- Global expansion: If you operate in multiple regions, roll out this standard model globally to ensure consistent service levels across all territories.
Now that you have an idea of how to build proactive monitoring systems in your contact center, watch the full .conf25 talk, From reaction to proaction: How HSBC uses Splunk ITSI for end-to-end contact center observability. In the talk, you'll learn more about best practices for end-to-end observability in complex environments and resilient contact center operations.
Finally, the following resources might help you understand and implement this guidance:
- Splunk Help: Overview of the Service Analyzer in ITSI
- Splunk Help: Create adaptive KPI thresholds in ITSI
- Splunk Help: Overview of the glass table editor in ITSI
- Splunk Lantern: Personally identifiable information
- Splunk Lantern: Knowing proper adaptive threshold configurations
- Splunk Lantern: Maintaining adaptive thresholds