Platform capacity considerations
Your Splunk deployment can expand to meet almost any capacity requirement, and those capacity needs will likely grow as new use cases of value are identified. There are several key dimensions of a Splunk deployment that impact capacity constraints. Understanding initial requirements, as well as growth strategies, will help ensure ongoing optimal performance.
- Amount of incoming data. The more data you send to your Splunk deployment, the more time it needs to process the data into events that you can search, report, and generate alerts on.
- Amount of indexed data. As the amount of data stored in a Splunk index increases, so does the I/O bandwidth needed to store data and provide results for searches. There might also be business or compliance needs for certain data types to be searchable longer than others.
- Number of concurrent users. If more than one person at a time uses an instance of Splunk, that instance requires more resources for those users to perform searches and create reports and dashboards.
- Number of saved searches. If you plan to invoke a lot of saved searches, your Splunk deployment needs capacity to perform those searches promptly and efficiently. A higher search count over a given period of time requires more resources.
- Types of search you use. The type of search that you run against a Splunk instance is almost as important as the number of saved searches is. There are several types of search, each of which affects how the indexer responds to search requests.
- Whether or not you run Splunk apps. Splunk apps and solutions can have unique performance, deployment, and configuration considerations. Premium apps, such as Splunk Enterprise Security and Splunk ITSI, might also have unique indexer performance considerations. See the app’s documentation for more information.
Search capacity considerations
The search, indexer, and storage architecture for Splunk Cloud Platform is designed and managed by Splunk.
The largest performance factors in a Splunk deployment are:
- The number of concurrent users
- The number of concurrent searches
- The types of searches used
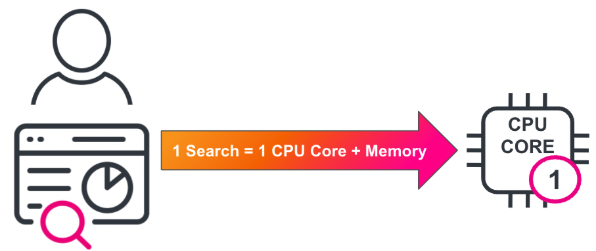
A user (or app) that submits a search request uses one CPU core on each indexer until the search is complete. Any additional searches that the user submits also account for one CPU core. The type of search a user invokes also impacts hardware resource usage. For more information on this, see How search types affect Splunk Enterprise performance.
In an active deployment, the system is not sitting idle while searches arrive. If an indexer ingests 150GB/day of data, then it uses up to ~4 of the available CPU cores for indexing processes.
|
Concurrent Searches |
Indexer CPU Cores |
Searches per CPU Core |
~Seconds per Search (search type) |
~Seconds to Complete Search |
|---|---|---|---|---|
|
12 |
12 |
1 |
10 |
10 |
|
48 |
12 |
4 |
10 |
40 |
Having fewer indexers with greater core counts per indexer can decrease the amount of total time for search, but also reduces scaling efficiency by providing less aggregate input/output operations per second (IOPS) for search operations.
Adding overall indexers reduces the indexing load on any one machine. Additionally, you reduce the search time, lower the impact of high search concurrency, and lower the impact of resource contention for I/O and memory.
While user counts are often used as a proxy for search load, keep in mind not all users and searches are equal. For example, one active user with admin-level search concurrency can sustain the same load on the Splunk platform deployment as several users at a lower role level.
Defining the maximum number of concurrent searches that a user is allowed, by role, can help to manage search volume and incentivize user access. For more information on this, see Enabling users with incentives.
Hardware capacity considerations
The table below is a general guideline of reference machines needed to index and search data in Splunk Enterprise. This guideline is based on the number of concurrent users and the amounts of data that the instance indexes. However, all use cases are different. If you need help defining and scaling a Splunk Enterprise environment, contact your Splunk Sales representative or Professional Services.
A hypervisor (such as VMware) must be configured to provide reserved resources that meet the hardware specifications above. An indexer in a virtual machine might consume data about 10 to 15 percent more slowly than an indexer hosted on a bare-metal machine. Search performance in a virtual hosting environment is similar to bare-metal machines.
Hardware suggestions based on daily indexing volume and concurrent users
|
< 2GB/day |
2 to 300 GB/day |
300 to 600 GB/day |
600GB to 1TB/day |
1 to 2TB/day |
2 to 3TB/day |
|
|---|---|---|---|---|---|---|
|
Total Users: less than 4 |
1 combined instance |
1 combined instance |
1 Search Head, 2 Indexers |
1 Search Head, 3 Indexers |
1 Search Head, 7 Indexers |
1 Search Head, 10 Indexers |
|
Total Users: up to 8 |
1 combined instance |
1 Search Head, 1 Indexers |
1 Search Head, 2 Indexers |
1 Search Head, 3 Indexers |
1 Search Head, 8 Indexers |
1 Search Head, 12 Indexers |
|
Total Users: up to 16 |
1 Search Head, 1 Indexers |
1 Search Head, 1 Indexers |
1 Search Head, 3 Indexers |
2 Search Heads, 4 Indexers |
2 Search Heads, 10 Indexers |
2 Search Heads, 15 Indexers |
|
Total Users: up to 24 |
1 Search Head, 1 Indexers |
1 Search Head, 2 Indexers |
2 Search Heads, 3 Indexers |
2 Search Heads, 6 Indexers |
2 Search Heads, 12 Indexers |
3 Search Heads, 18 Indexers |
|
Total Users: up to 48 |
1 Search Head, 2 Indexers |
1 Search Head, 2 Indexers |
2 Search Heads, 4 Indexers |
2 Search Heads, 7 Indexers |
3 Search Heads, 14 Indexers |
3 Search Heads, 21 Indexers |
Index and search clusters
When planning for a user count of 50 or more, consider implementing a search head cluster to absorb a high level of users while adding redundancy to the search tier.
An indexer cluster is a group of indexers configured to replicate each others' data, so that the system keeps multiple copies of all data. This process is known as index replication. By maintaining multiple, identical copies of data, indexer clusters prevent data loss while promoting data availability for searching.
Splunk Enterprise clusters feature automatic failover from one indexer to the next. This means that, if one or more indexers fail, incoming data continues to get indexed and indexed data continues to be searchable.
In addition to enhancing data availability, clusters have other features that you should consider when you are scaling a deployment, for example, a capability to coordinate configuration updates easily across all indexers in the cluster. Clusters also include a built-in distributed search capability. For more information on this, see About clusters and index replication.
Premium Splunk app requirements
Premium Splunk apps can demand greater hardware resources than the reference specifications in this topic provide. Before architecting a deployment for a premium app, review the app documentation for additional scaling and hardware recommendations. The following list shows examples of some premium Splunk apps and their recommended hardware specifications.
Disk storage
Searchable data
Splunk Enterprise stores raw data at up to approximately half its original size with compression. On a volume that contains 500GB of usable disk space, it might be possible to store nearly six months of data at an indexing rate of 5GB/day or ten days at a rate of 100GB/day. Keep in mind that the compression rate is based on the data structure, and can be more accurately estimated using your own test data. Consider any business or compliance needs for data retention when estimating storage.
At a high level, the Splunk platform calculates total disk storage as follows: (Daily average indexing rate) x (retention policy) x 1/2
The indexer hardware role requires high performance SSD storage for writing and reading (searching) the hot and warm index buckets. The default storage volume path is the same for hot and warm buckets, as well as data model acceleration storage.
If you need additional Splunk Enterprise cold or frozen storage: you can opt for additional local HDD, SAN, NAS, network file systems, or SmartStore hybrid cloud storage. Searches that include data stored on network volumes are slower.
For more information on the role that data volume plays in determining the total cost of ownership of the Splunk platform, see Sizing your Splunk architecture.
Archived data
In Splunk Enterprise, the indexed data stays within the customer environment, allowing the customer to design their own storage and backup strategies. In Splunk Cloud Platform, the indexed data is securely managed by Splunk directly. If there any compliance or business need to self-manage cloud data as it ages out, Splunk offers customers flexibility and choice. The primary archive methods are “Dynamic Data: Active Archive” (DDAA) and “Dynamic Data: Self-Storage” (DDSS).
There are two key differences between the two capabilities:
- Data Management. With DDAA, Splunk provides complete lifecycle management of the archive on your behalf and remains the custodian of your data. Just like your active, searchable data, Splunk manages all aspects of archive availability, durability, security, and privacy requirements on your behalf. With DDSS, you (the customer) are responsible for data after it ages out. You define an Amazon S3 self-storage location and decide data from which indexes lands there. After the data lands in self-storage, you're in complete control.
- Data Restore. DDAA enables you to request a slice of your data to be restored back into your Splunk Cloud Platform instance. The entire workflow is fully integrated into Splunk Web so your archived data is readily available with predictable time between retrieval to search. With DDSS, if you want to search against the data stored in a self-storage location, you need to restore it to a separate Splunk instance.
For more information specific to the Splunk Cloud Platform, see Dynamic data: Data retention options in Splunk Cloud Platform.
Go further with Splunk Outcome Paths
If this disk storage guidance helped you, you might also be interested in Monitoring and alerting in storage. That article is part of a series of prescriptive strategies designed to help you reduce the total cost of ownership of the Splunk platform by reducing your infrastructure footprint.
Splunk Monitoring Console
The Monitoring Console is a search-based monitoring tool that lets you view detailed information about the topology and performance of your Splunk Enterprise deployment. The Monitoring Console provides pre-built dashboards that give you visibility into many areas of your deployment, including search and indexing performance, resource usage, license usage, and more. You can use the Monitoring console to track the status of all types of deployment topologies, from single-instance (standalone) deployments to complex multi-site indexer clusters. For more information, see Monitoring Console or Cloud Monitoring Console.
Additional resources
You can ask your CSM about a DSA (Data source assessment) for further assistance with capacity planning. Additionally, these resources might help you understand and implement this guidance:
- Splunk Help: Introduction to capacity planning for Splunk Enterprise
- Splunk Help: Reference hardware
- Splunk Lantern Article: Sizing your Splunk architecture
- Splunk Lantern Article: Optimizing Splunk knowledge bundles
- Splunk Lantern Article: Defining data retention policies
- Splunk Lantern Article: Monitoring and alerting for key event readiness