Getting started with the Google ChromeOS App for Splunk
You’re a SOC analyst who understands that as employees spend more time interacting with ChromeOS endpoints, the chances of risky behavior impacting enterprise resiliency increases. You are concerned about the following risky behavior:
- Multiple failed login attempts on a device
- USB peripherals added to an endpoint
- Unaffiliated or unauthorized users added to a device or system
- Multiple Chrome Remote Desktop sessions on a device
- Logins from a guest or unaffiliated user
- Multiple screenshot attempts
The Google Chrome Add on for Splunk and Google ChromeOS App for Splunk help to address these risks by:
- Bringing Chrome Threat and Data Protection events into the Splunk platform and mapping them to the Splunk Common Information Model (CIM) to allow for easy correlation with other data sources and maximum efficiency at search time.
- Providing prebuilt dashboards and analytics to help investigate the most critical incidents of suspicious logins, device, and session/endpoint activities.
- Alerting on the events that are the most important and automatically responding to these events with the following actions:
- Move a device to an organizational unit (OU)
- Move a user to an organizational unit (OU)
- Issue commands to suspend users
- Issue commands to wipe a device
- Issue commands to wipe users
- Issue commands to reboot a device
- Issue commands to disable a device
How to use Splunk software for this use case
Configuration
Requirements
- Splunk platform version 9.0 or 9.1 and above
- Chrome Browser Cloud Management (CBCM)
- Reporting Connector for CBCM
- Google Chrome Add-on for Splunk
Step 1: Prepare the Splunk platform
- In your Splunk instance, navigate to Settings > Data Inputs > HTTP Event Collector.
- To issue a new token, click New Token. It is recommended to create a new index for testing the Chrome event ingestion at first.
- Enter a name for the token, and leave the other fields as their default values. You do not need to select Enable indexer acknowledgement.

- On the next page, leave the Source type set to Automatic, and either create a new or select an existing index for testing Chrome event ingestion.

- Click Review, then Submit if the information is correct.
- Copy the HEC token value for use in the next step.
Step 2: Set up the Splunk integration in Chrome Browser Cloud Management (CBCM)
Using the newly created Splunk HEC token, set up the Splunk reporting connector in the CBCM console. For instructions, see Getting started with the Splunk integration in Chrome Browser Cloud Management.
It is also recommended that you update the browser reporting frequency from the default of 24 hours to the minimum of 3 hours so that extension data is reported more frequently. For more information, see Turn on Chrome browser reporting in the Google documentation.
Step 3: Install and configure the service account and external lookup inputs
- Install the Google Chrome Add on for Splunk from Splunkbase. For instructions, see Install apps on your Splunk Cloud Platform deployment.

- In the Google Chrome Add-on for Splunk, navigate to the Configuration panel.
- To create a new service account configuration, click Add.
- Input the required credentials as shown in the following screenshot. You can obtain these from the CBCM console.

- In the Google Chrome Add-on for Splunk, navigate to the Inputs panel.
- Click Create New Input and create the Extensions Lookup Query input. Use the Service Account that you saved in the Configuration panel.
- Use the Create New Input button to create the data input for the type Organization Units Lookup Query. Use the Service Account that you saved in the Configuration panel.

Step 4: Verify the configuration
- If you have already set up the Splunk Reporting Connector in the Google Chrome Admin console, there might already be events in the Splunk instance. Run a search for events using the test index with
index="chrome_test". - If there are no events, you can simulate chrome browser events using the website (Safe) Safe Browsing Testing Links.
- If there are still no events, then review and repeat the setup steps to ensure everything is configured correctly.
Set up the Google ChromeOS App for Splunk
- In your Splunk instance, navigate to Apps > Find More Apps.
- Search Google Chrome App for Splunk and install. For instructions, see Install apps on your Splunk Cloud Platform deployment.
- Configure the chromeos_index macro to use the same index that the HEC token is configured for.
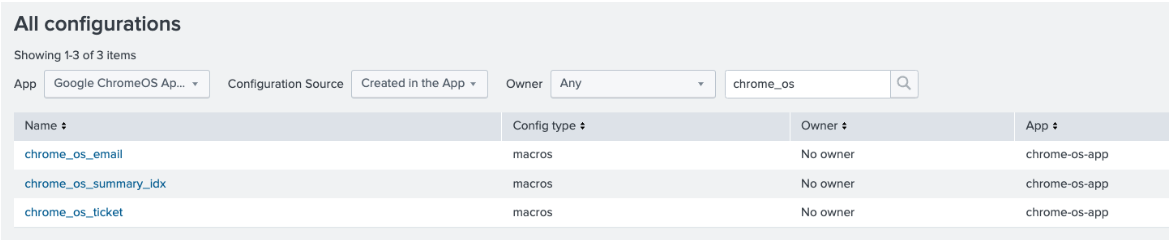
- Navigate to Settings > All configuration > Select app > Created in app.
- Edit the macro chromeos_index and adjust the index name based on where you are getting data for ChromeOS events. By default, it is set to “chromeos” and must be created at the time HEC input is set up.
- Create a new index (for example, chromeos_summary) to store the summary of alert actions taken.
- Edit the macro chrome_os_summary_idx so that it references the new summary index. By default, it references chromeos_summary. This macro is referenced in the app dashboard operations telemetry view.
.png?revision=3)
- To fill data in the summary index, schedule alerts according to your requirements.

Alert Name
Purpose
Guest or unaffiliated user successfully logs in
Capture events whenever any guests or unaffiliated users login. Event gets captured during login.
Multiple CRD sessions on device
Capture events whenever the count of CRD sessions on a device exceeds the threshold.
Multiple failed login attempts
Capture events whenever the count of consecutive failure attempts on a device exceeds the threshold.
Multiple screenshot attempts
Captures events whenever the trigger type (screenshot) exceeds the threshold.
USB peripherals are added to a device
Captures events whenever USB peripherals are added to the device.
Unaffiliated user added to device
Captures events whenever an unaffiliated user is added to the device.
- Edit the Google_ChromeOS_Alerts_threshold.csv lookup and set each alert threshold as needed.
.png?revision=3)
- Enable the six default alerts provided by the app. To access these, go to Settings > Searches, Reports, and Alerts > App: Google ChromeOS App for Splunk, Owner: All. If you wish for the summary index to collect data that was ingested before the app was installed, and the saved searches were run, then you must manually run each alert with a time range that includes the historical data. Set the search time range latest to exclude data that may have already been added to the summary index, as this leads to duplicate events.
- Enable the "Google chromeOS workflow internal lookup" report. It is used to populate the Google_ChromeOS_Workflow KVstore lookup from _internal index using workflow action activities logs.
- Verify that the data has been ingested correctly by viewing one of the dashboards in the app and ensuring the visualizations are populated.
FAQ
Q: What products do I need for this?
A: Splunk version 9.0 and 9.1 and Chrome Browser Cloud Management.
Q: Do I need to have Splunk Enterprise Security?
A: Splunk Enterprise Security is not required. All events are CIM tagged so any Splunk Enterprise Security content built on the data models that an event is tagged to will populate with the tagged event.
Q: Is this a jointly developed product with Google?
A: Yes, we jointly developed this product with Google Chrome.
Q: What types of events are ingested? Does this include ChromeOS events?
A: ChromeOS events ingested which are CIM compatible are:
- ChromeOS login failure/success/logout/user added/user removed
- ChromeOS USB device added/removed/status change
- ChromeOS CRD host started/client connected/client disconnected/host stopped
- Data access control
Q: Where can I find this app? Will it be Splunk supported?
A: The app is in Splunkbase and is Splunkworks supported.
Next steps
Learn how to configure alert actions with the Google Chrome Add on for Splunk, or, learn more about the Google Chrome App for Splunk.
Still need help? Check out some of the resources below or email our team directly at splunkchrome-external@google.com.
- Google Support Docs: CBCM set up, enrollment, and admin console
- YouTube: Signing up for Chrome browser cloud management
- YouTube: A tour of Chrome browser Cloud management
- YouTube: Tips for getting started in Chrome browser cloud management