Getting started with Microsoft Azure Event Hub data
Microsoft defines Azure Event Hubs as “a big data streaming platform and event ingestion service”. Most services inside of Azure, and some services outside of Azure, integrate with Event Hubs.
There are three main components to an Event Hub solution:
- An event producer - something has to put data on the hub. You'll look at how Azure Monitor puts data on a hub later in this article. Third-party applications can put data on Event Hubs too.
- The Event Hub itself - you can think of the Event Hub as a scalable short-term bus for events. Events only “live” on a hub for a short period of time (typically 24 hours to 7 days), and the events are meant to be read/consumed by some other system(s) during that time.
- An event consumer - the event consumer reads events that were put on the hub by the event producer. For our purposes, Splunk is the event consumer.
This article provides guidance on how to integrate the Splunk platform with Azure Event Hubs using the Microsoft Cloud Services App. For general recommendations or different methods of data ingestion, see the Getting Microsoft Azure data into the Splunk platform.
How to use Splunk software for this use case
Configuration
Overview
There are four basic steps to follow:
- Creating an Event Hub Namespace
- Sending Data to an Event Hub
- Setting up Authentication
- Setting up the Splunk Add-on for Microsoft Cloud Services
If you already have data in an Event Hub you want to ingest, skip to step 3 to ensure authentication is set up correctly for the Splunk add-on.
Step 1 - Create an Event Hub Namespace
An Event Hub Namespace is a container for individual Event Hubs. You aren’t creating any Event Hubs in this step, just creating a home for Event Hubs.
- Log into the Azure portal - https://portal.azure.com
- Type event hub in the search bar and click the Event Hubs service.

3. Click the Create button.

4. Fill out the details and click the Create button.

Step 2 - Send data to an Event Hub
Use an Azure Monitor diagnostic setting to send Azure activity logs to an Event Hub. A diagnostic setting defines what to send where. In this case, you are going to send Azure Activity logs to an Event Hub. This same technique of creating a diagnostic setting can be used for most services in Azure as well as Azure Active Directory.
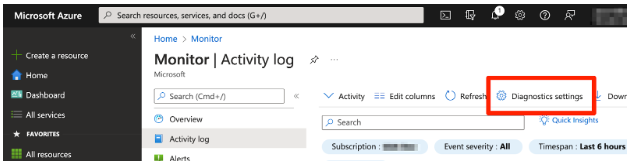
1. Type monitor in the search bar and click the Monitor service.

2. Click Activity log.

3. Click the Diagnostics settings button.
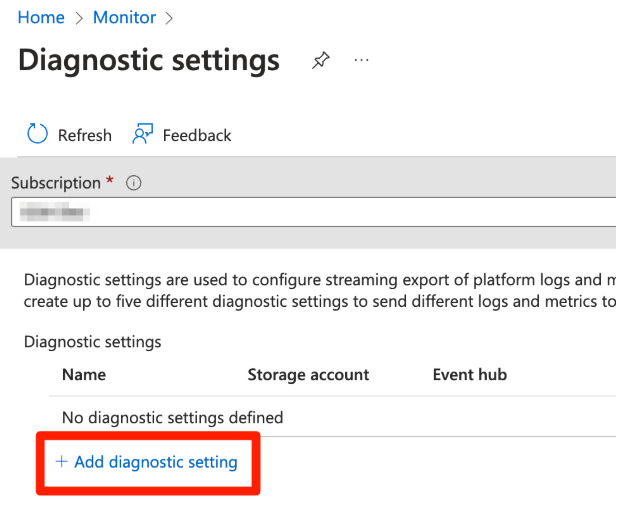
4. Click Add diagnostic setting.
5. Give the diagnostic setting a name, select which log categories you want to export to the Event Hub in the Categories section, and select Stream to an event hub in the Destination section. When selecting the Stream to an event hub option, select the Event Hub Namespace.

6. Click Save.
In this example you are letting the diagnostic setting create an Event Hub in the selected Event Hub Namespace for you. This is optional if you want to use an existing Event Hub.
Step 3 - Set up authentication
In order to consume data from an Event Hub, some sort of authentication needs to happen. This is typically done via a connection string or an Azure AD application registration. The Splunk Add-on for Microsoft Cloud Services uses an Azure AD application registration, so that is what you'll cover next.
1. Type azure active directory in the search bar and click the Azure Active Directory service.

2. Select App registrations.

3. Click the New registration button.

4. Give the application registration a name, choose Single-tenant as the account type, and click the Register button. The Redirect URI is not needed.

5. After the application is registered, an overview screen will appear. Copy the Application (client) ID and Directory (tenant) ID. You'll need to use these in step 5.

6. Click Certificates & secrets as shown in the screenshot in step 5, above. Then click the New client secret button.
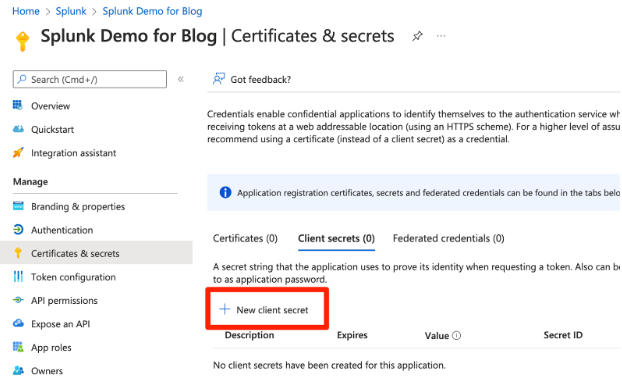
7. Provide a description and expiration date, and then click the Add button.
8. After the secret is created, the value will be displayed in the Azure portal. The Secret ID is not used. This is the only time you will see the value in plain text, so make a copy of it now as you will need it later. If you lose this value, you will need to create a new secret.

Step 4 - Set up role assignments
Now that you have your Azure AD application registration, you'll need to add it to the Azure Event Hubs Data Receiver Role.
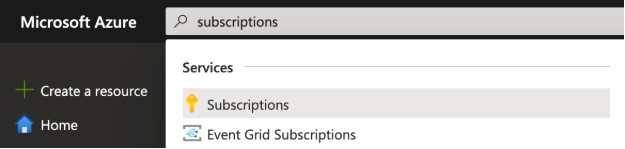
- Type subscriptions in the search bar and click the Subscriptions service.
- Select your subscription, and then click Access control (IAM).
- Click the Add button, and then select the Add role assignment option.

- In the search box, type Azure Event Hubs. Select the Azure Event Hubs Data Receiver role in the table, and then click the Next button.

- Click the Select members button. Type the name of the Azure AD Application Registration you created earlier. Click the name of the application so that it shows up in the Selected members section. Then, click the Select button.

- Click the Review + assign button.
- Once the process finishes, click Role assignments and check that the application is in the Azure Event Hubs Data Receiver role.

Repeat step 4 for any other subscriptions that contain Event Hubs that will be consumed by Splunk.
Step 5 - Configure the Splunk Add-on for Microsoft Cloud Services
Now, configure the Splunk Add-on for Microsoft Cloud Services.
- Under the Configuration menu, ensure Azure App Account is selected, and then click the Add button.

- Give the account a name and paste the values obtained in step 3. Then, click the Add button.
Client ID = Application (client) ID

Key (Client Secret) = the value of the client secret

Tenant ID = Directory (tenant) ID

- Click the Inputs menu item, then click the Create New Input button and select Azure Event Hub.

- Provide a name for the input and select the account created in the previous step.

- To get the value you'll need to enter into the Event Hub Namespace (FQDN) field, go to the Azure portal again. Type event hub in the search bar and click the Event Hubs service. A list of Event Hub Namespaces will be displayed.

- Select the appropriate Event Hub Namespace in the table, and an overview page should appear. The Host name value is the Event Hub Namespace (FQDN). In the below image, the Event Hub Namespace (FQDN) is
splunkblog.servicebus.windows.net.
- An Event Hub Namespace contains one or more Event Hubs. To get the Event Hub name, first click on Event Hubs under the Entities section from the same screen as step 6, above. You may need to scroll down to see this. You'll then see your individual Event Hubs displayed in a table. If you let Azure create an Event Hub for you when setting up your Activity log diagnostic setting earlier, you'll see the Event Hub name that it created. In this example the Event Hub name is
insights-activity-logs. This is the value you need for the Splunk input.
- Your final input should look like the following:

Add in the following settings:
- Consumer group Every application that reads data from an Event Hub must have a distinct consumer group. For example, if both Splunk and a custom application are both reading from the same Event Hub, then each would need a unique consumer group. Consumer groups allow multiple consuming applications to each have a separate view of the event stream.
- Transport Type. This is the outbound protocol that the Splunk forwarder will use to connect to the Event Hub. AMQP over WebSocket (the default) will use TCP 443 (https). If you select AMQP, then port 5671 outbound needs to be open. If you use AMQP with a proxy, port 5672 outbound needs to be open.
- Sourcetype. This is the Splunk source type that will get tagged with the data (mscs:azure:eventhub is the default). Typically, the same type of data is in the same Event Hub. It's recommended to set a sourcetype value for the type of data you are consuming from the Event Hub, instead of using the default. This will make searching easier down the road.
- Click the Add button, and you should start seeing data in your index.

Repeat the procedures in step 5 for any additional event hubs you want to consume.
Common problems and troubleshooting
If everything isn't working as expected, run the following search:
index=_internal sourcetype="mscs:azure:eventhub:log"
|
Message |
Typical root cause |
|
The messaging entity 'sb://eventhubnamespace.servicebus.wi...s.net/eventhub' could not be found |
Incorrect Event Hub name specified in the input. |
|
Please confirm target hostname exists |
Incorrect Event Hub namespace (FQDN) specified in the input. |
|
Failed to open mgmt link: MgmtOpenStatus.Error\nFailed to open mgmt link: MgmtOpenStatus.Error |
Outbound ports from the Splunk instance to Microsoft are blocked. See the notes on transport type above. Your Event Hub Namespace is configured to only allow network traffic from selected networks, and the IP address of your Splunk instance is not allowed. Possible SSL header insertion - ensure no private certificates are in use in the certificate chain. |
|
Status code: 401 Message: 'Attempted to perform an unauthorized operation.' |
The Azure AD application registration is not in the Azure Event Hubs Data Receiver Role. See the procedures in step 3 above. |
|
An error occurred while receiving. The exception is ConnectionLostError("New receiver 'nil' with higher epoch of '0' is created hence current receiver 'nil' with epoch '0' is getting disconnected.”) |
More than one application is using the same consumer group. See the consumer group information in step 5. |
Tuning and performance
The official Splunk documentation details tuning considerations. For example, pay attention to the guidance on throughput units and the ratio of Splunk inputs to partitions. You should typically have one input per Event Hub partition. This means if your Event Hub has 4 partitions, you should have 4 Splunk inputs all reading from the same hub. This works fine as long as all the Splunk inputs are in the same consumer group as Microsoft will load-balance each input to a specific partition.
Another good resource is the performance reference documentation where VM sizes, number of inputs, parallel ingestion pipeline parameters, etc. are called out. These numbers show ingestion rates of multiple terabytes per day using a single Splunk forwarder.
Next steps
When your Splunk deployment is ingesting Azure Event Hub data, you can use the data to achieve a wide range of security and observability objectives.
In addition, these resources might help you understand and implement this guidance:
- Splunk Lantern Article: Managing Azure cloud infrastructure