Collecting Mac OS log files
You want to get log data from a Darwin (Mac OS X) device into an observability platform.
How to use Splunk software for this use case
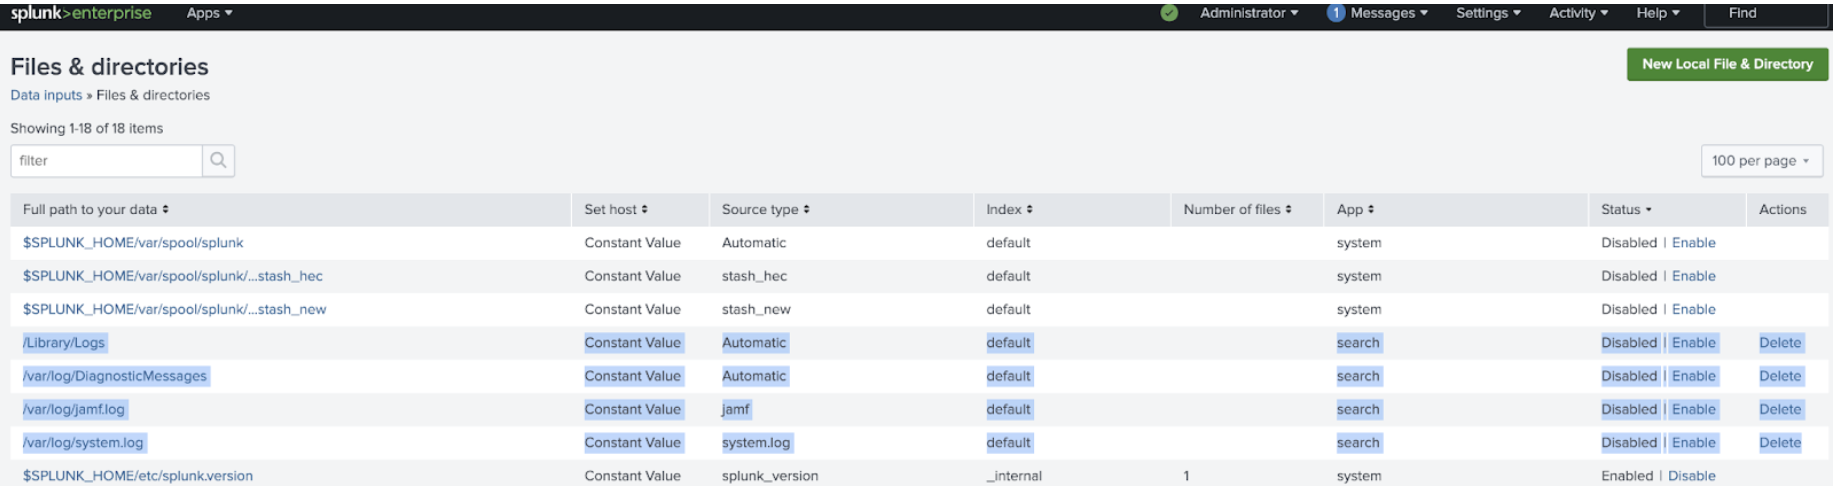
In order to monitor logs on the Darwin (Mac OS X) system, you can use a local copy of Splunk Enterprise or an OpenTelemetry Collector to forward logs and metrics to Splunk Observability Cloud and the Splunk platform. What logs you need to monitor depends on the applications, asset management, vpn, and security services. The following are some examples:
- System Application Logs:
- /Library/Logs
- Analytics:
- /var/log/DiagnosticMessages
- Reports:
- /Library/Logs/DiagnosticReports
- Jamf:
- /var/log/jamf.log
- CrashPlan:
- /Library/Logs/CrashPlan/service.log.0
- System Logs:
- /var/log/system.log
- /var/log/*
Splunk Enterprise
If you are running a local instance of the Splunk platform on your system, these files can be monitored by adding a file and directory input.
Splunk Observability Cloud
You can also collect log and host metrics with the OpenTelemetry Collector using the filelog receiver exporting logs to a Splunk HEC endpoint. The following is an example of a file log receiver yaml configuration:
receivers:
  filelog:
    include: [ /var/log/system.log ]
    start_at: beginning

exporters:
 # Logs
  splunk_hec/logs:
    token: "${SPLUNK_HEC_TOKEN}"
    endpoint: "${SPLUNK_HEC_URL}"
    index: "logs"
    max_connections: 20

processors:
  batch:
  memory_limiter:
    check_interval: 2s
    limit_mib: ${SPLUNK_MEMORY_LIMIT_MIB}
# Add optional environment metadata to logs and traces.
  resource/add_environment:
    attributes:
      - action: insert
        value: HW.Laptop
        key: deployment.environment

service:
  logs:
    receivers: [fluentforward, otlp, filelog]
    processors:
    - memory_limiter
    - batch
    - resource/add_environment
    exporters: [splunk_hec/logs]
macOS Unified Logging Receiver
The macOS Unified Logging Receiver collects logs from the Apple Unified Logging System (ULS). This is the modern standard for system and application logs on macOS, replacing many traditional log files.
macOS Unified Logs are stored in a proprietary, compressed binary format (typically .tracev3 files) within /var/db/diagnostics. Because these files are not plain text, they cannot be processed using the standard OpenTelemetry filelog receiver. Attempting to do so will result in unreadable binary data. The macos_unified_logging receiver is required because it interfaces with the native macOS log utilities to translate these binary records into a structured format that Splunk can index.
For more information, see macOS Unified Logging Receiver (GitHub).
Requirements
- OS Version: macOS 10.12 (Sierra) or later.
- System Tools: The
logcommand must be available in the system PATH. - Archive Mode: Read access to the target
.logarchivedirectory is required. - Live Mode: Appropriate system permissions (e.g., Full Disk Access) to read system logs.
Minimal configuration example
This example demonstrates the bare-minimum configuration required to stream macOS Unified Logs to Splunk via HEC. For a complete host configuration including performance metrics, see Example agent_config.yaml - Host metrics and logs.
receivers:
  macos_unified_logging:
    # Captures logs from the 'com.apple' subsystem
    predicate: "subsystem BEGINSWITH 'com.apple'"

exporters:
  splunk_hec/logs:
    token: "${SPLUNK_HEC_TOKEN}"
    endpoint: "${SPLUNK_HEC_URL}"

service:
  pipelines:
    logs:
      receivers: [macos_unified_logging]
      exporters: [splunk_hec/logs]
When running the OpenTelemetry Collector on macOS, ensure the binary has the necessary permissions to run the log command and access system log databases. If logs are not appearing, verify that the predicate matches the events you are expecting to see (e.g., use subsystem == 'com.your.app' for specific application logs).
Validation
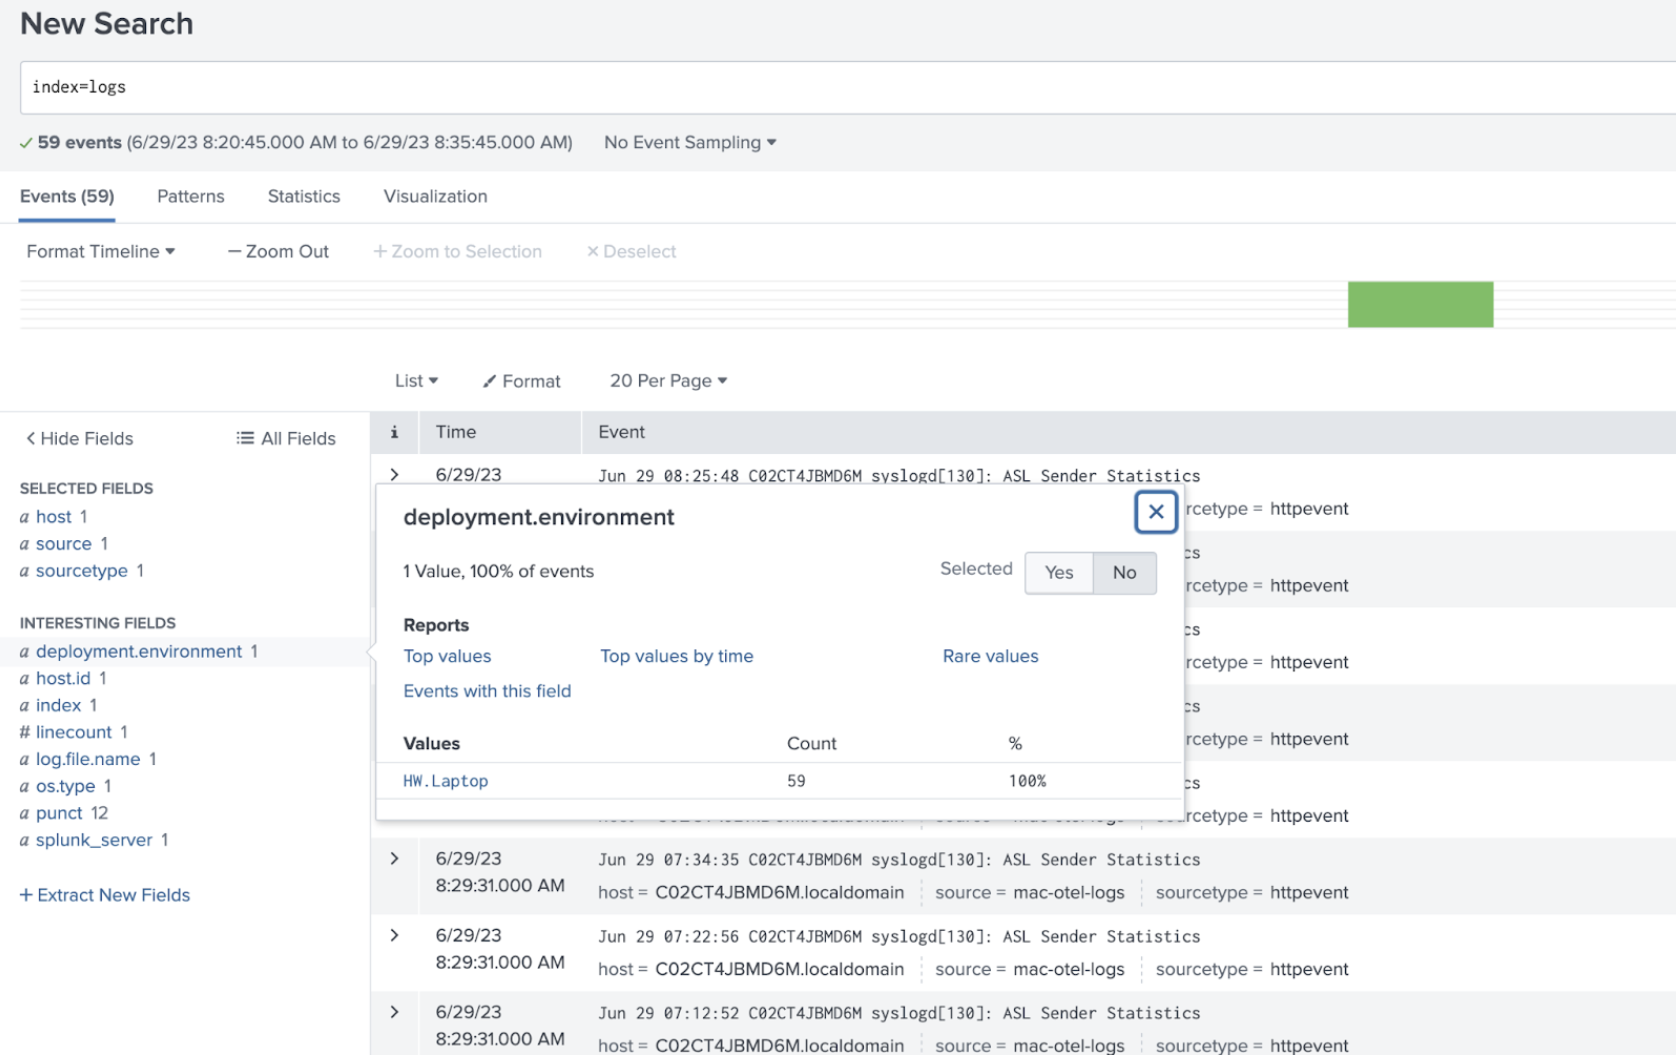
After you have your logs configured to export to your Splunk instance, navigate to search, and check the index the logs were sent to.
Troubleshooting
If you receive a 401: Unauthorized error, make sure you have the environment variables set for SPLUNK_HEC_TOKEN and the SPLUNK_HEC_URL endpoint. In the example error below, the SPLUNK_HEC_URL was not set and the export of the logs failed. You need to stop the Collector and restart it with the environment variables set.
        2023-06-29T08:15:34.473-0700 error exporterhelper/queued_retry.go:401 Exporting failed. The error is not retryable. Dropping data.
{"kind": "exporter", "data_type": "logs", "name": "splunk_hec/logs", "error": "Permanent error: \"HTTP/2.0 401 Unauthorized\\r\\nContent-Length: 0\\r\\nDate: Thu, 29 Jun 2023 15:15:34 GMT\\r\\nServer: istio-envoy\\r\\nWww-Authenticate: Basic realm=\\\"Splunk\\\"\\r\\nX-Envoy-Upstream-Service-Time: 3\\r\\n\\r\\n\"", "dropped_items": 1}
go.opentelemetry.io/collector/exporter/exporterhelper.(*retrySender).send
This example command shows how to start the OpenTelemetry Collector from the /etc/otel/collector/ directory. This includes the environment variables used in the example agent_yaml config.
SPLUNK_HEC_URL=https://splunk:8088/services/collector
SPLUNK_HEC_TOKEN=00000000-0000-0000-0000-0000000000000
SPLUNK_API_TOKEN=c2lnbmFsZnh0b2tlbgo===
SPLUNK_ACCESS_TOKEN=c2lnbmFsZnh0b2tlbgo===
SPLUNK_API_URL=https://api.us0.signalfx.com
SPLUNK_INGEST_URL=https://ingest.us0.signalfx.com/
SPLUNK_TRACE_URL=https://ingest.us0.signalfx.com/v2/trace
SPLUNK_COLLECTD_DIR=/usr/local/opt/collectd
SPLUNK_REALM=us0 ./otelcol --config=/etc/otel/collector/agent_config.yaml
Additional resources
- Apple Docs: Find text in log messages and reports in Console on Mac
- Apple Docs: Find log messages and activities in Console on Mac
- Blog: Best practices for MacOS logging & monitoring
- Splunk GitHub: otel-collector-config.yml
- Splunk GitHub: filelogreceiver
- Splunk GitHub: otel-collector-config.yml - An example yaml with a file log receiver and multiple Splunk source types
Example agent_config.yaml - Host metrics and logs
This example configuration is set up to send data to both Splunk Observability Cloud using the host metrics receiver and logs to Splunk Enterprise using the file log receiver.
# Required Environment Variables:
# - SPLUNK_ACCESS_TOKEN: Splunk Observability Cloud token
# - SPLUNK_REALM: The Splunk realm (e.g., us0, eu0)
# - SPLUNK_HEC_TOKEN: Splunk HEC authentication token
# - SPLUNK_HEC_URL: Splunk HEC endpoint (e.g., https://hec.splunk.com:8088/services/collector)

receivers:
  # 1. Host Performance Metrics
  hostmetrics:
    collection_interval: 10s
    scrapers:
      cpu:
      disk:
      filesystem:
      memory:
      network:
      load:
      paging:
      processes:

  # 2. Traditional File Logs
  filelog:
    include: [ /var/log/system.log ]
    start_at: beginning

  # 3. macOS Unified Logging (ULS)
  macos_unified_logging:
    predicate: "subsystem BEGINSWITH 'com.apple'"
    start_time: "2026-01-01 00:00:00"

processors:
  batch:
  # Essential for preventing the collector from over-consuming host memory
  memory_limiter:
    check_interval: 2s
    limit_mib: ${SPLUNK_MEMORY_LIMIT_MIB}
  # Adds host.name and os.type automatically to your data
  resourcedetection:
    detectors: [system]
    override: true

exporters:
  # Metrics to Splunk Observability Cloud
  signalfx:
    access_token: "${SPLUNK_ACCESS_TOKEN}"
    realm: "${SPLUNK_REALM}"
  # Logs to Splunk Enterprise/Cloud via HEC
  splunk_hec/logs:
    token: "${SPLUNK_HEC_TOKEN}"
    endpoint: "${SPLUNK_HEC_URL}"
    source: "otel_collector"
    sourcetype: "apple:unified_logging"

service:
  # No extensions block needed for standard operation
  pipelines:
    metrics:
      receivers: [hostmetrics]
      processors: [memory_limiter, batch, resourcedetection]
      exporters: [signalfx]
    logs:
      receivers: [filelog, macos_unified_logging]
      processors: [memory_limiter, batch, resourcedetection]
      exporters: [splunk_hec/logs]