Reviewing GCP CloudSQL slow query logs
Analyzing slow queries is a crucial process for identifying and resolving performance bottlenecks in your database instances. The method for enabling slow query logs varies slightly depending on whether you are using a MySQL or PostgreSQL Cloud SQL instance, but this article covers everything you need.
If you haven't already configured your Splunk platform deployment to ingest GCP Cloud SQL logs from Postgres, MySQL, and SQL Server databases, review Monitoring Google Cloud SQL first.
Data required
How Splunk software can help with this use case
Use the following general base search to get the right source type, source, and specific database (if desired).
index="gcp-auditlogs"
    sourcetype="google:gcp:pubsub:platform"
    source="projects/project_id/subscriptions/cloudsql_auditlogs
_sub_id"
    "data.resource.labels.database_id"="gcp-appdcloudplatfo-nprd
-id:db_name"
PostgreSQL
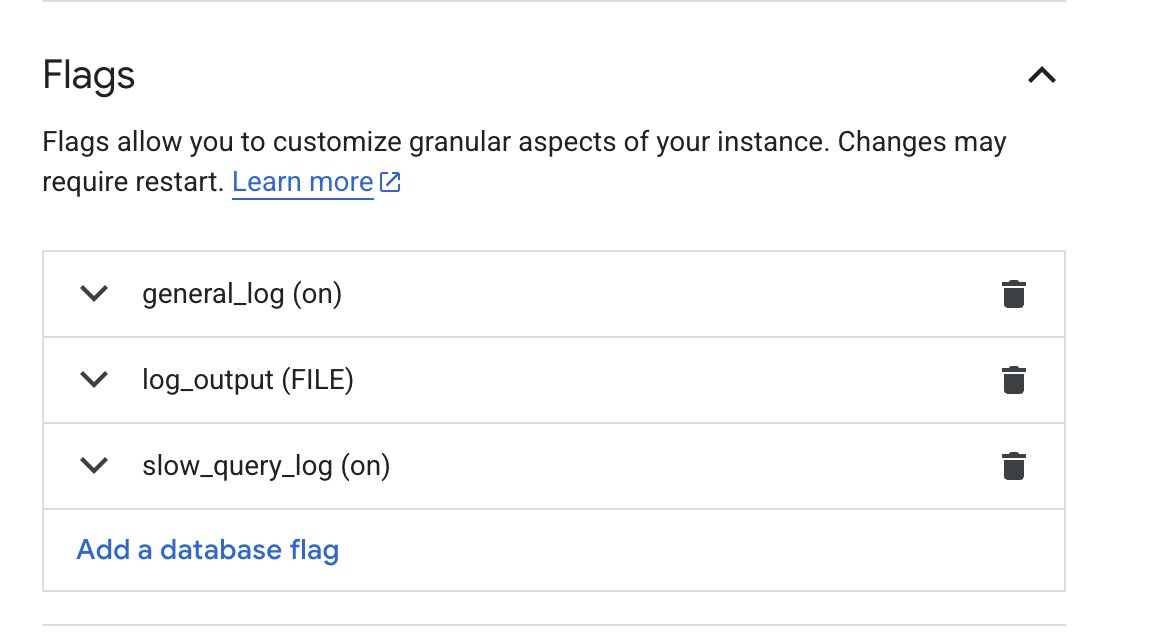
Enable the database flag for logging queries that take longer than N milliseconds.
log_min_duration_statement: This parameter is crucial for slow query logging. It specifies the minimum execution time (in milliseconds) for a query to be logged.- Setting it to -1 disables logging based on duration.
- Setting it to 0 logs all queries, regardless of their duration.
- Setting it to a positive value (for example, 500) logs all queries that take longer than that many milliseconds to execute.
For more information, see Configure database flags.
<base search>
| spath data.textPayload
| rename data.textPayload AS textPayload
| rex field=textPayload "db=(?<db_name>[^,]+),user=(?<db_user>[^,]+),host=(?<db_host>\S+)"
| rex field=textPayload "duration:\s(?<duration>\d+\.\d+)\sms"
| rex field=textPayload "statement:\s(?<sql_statement>.*)"
| rex field=sql_statement "^(?<sql_operation>\w+)"
| table _time, db_name, db_user, db_host, duration, sql_statement, sql_operation, textPayload
| where duration > 3000
You can use the duration field to identify the length of queries in milliseconds, and filter by the ones that exceed a given amount of time.
MySQL
First, ensure that you enable the flag for slow query logs.
<base search>
"data.logName"="projects/gcp-appdcloudplatfo-nprd-68190/logs/cloudsql.googleapis.com%2Fmysql-slow.log"
| spath data.textPayload
| rex field=data.textPayload "(?s)# Time:\s(?P<log_timestamp>\S+)\n# User@Host:\s(?P<user>\w+)\[\w+\]\s@\s+\[(?P<ip>\d{1,3}\.\d{1,3}\.\d{1,3}\.\d{1,3})\][^\n]*\n# Query_time:\s(?P<query_time>\d+\.\d+)[^\n]*\nSET timestamp=\d+;\n(?P<sql_query>.*)"
| table _time, log_timestamp, user, ip, query_time, sql_query, data.textPayload
You can use the data.logName field to narrow results to include only those from the mysql-slow.log file. Next, parse the data.textPayload field using regex to separate the values of the timestamp, user, connection IP, query time, and the SQL query.
The output of this search would look like the following table:
| _time | log_timestamp | user | ip | query_time | sql_query |
|---|---|---|---|---|---|
|
2025-08-19 18:19:55.284 |
2025-08-19T18:19:55.284516Z |
root | 10.128.0.50 | 12.000405 |
select sleep(12); |
This search could be used to populate a chart within a dashboard to visualize the number of slow-running queries over time, allowing users to monitor the performance of their database.
You can then create an alert based on the value of the query_time field. Using third-party integrations to external ticketing systems, an analyst could automatically identify long- running queries and assign them for investigation and optimization by the end user.
SQL Server
Since GCP CloudSQL SQL Server doesn't have a native slow query log flag, you use SQL Server Dynamic Management Views (DMVs) to capture query performance metrics and Splunk DB Connect to ingest the data.
- Create a slow query view in SQL Server that does the following:
- Filters for queries with average execution time > 3 seconds (3,000,000 microseconds). You can set this to whatever number you want.
- Only includes queries from the last 24 hours.
- Extracts the actual query text using sys.dm_exec_sql_text.
CREATE VIEW dbo.SlowQueries AS SELECT NEWID() AS query_id, SUBSTRING(qt.text, (qs.statement_start_offset/2)+1, ((CASE qs.statement_end_offset WHEN -1 THEN DATALENGTH(qt.text) ELSE qs.statement_end_offset END - qs.statement_start_offset)/2) + 1) AS query_sql_text, qs.last_execution_time, qs.total_elapsed_time / NULLIF(qs.execution_count, 0) / 1000.0 AS avg_duration_ms, qs.max_elapsed_time / 1000.0 AS max_duration_ms, qs.last_elapsed_time / 1000.0 AS last_duration_ms, qs.execution_count, CAST(qs.total_elapsed_time / 1000000.0 AS DECIMAL(18,2)) AS total_cpu_time_sec, COALESCE(DB_NAME(qt.dbid), 'Unknown') AS database_name FROM sys.dm_exec_query_stats qs CROSS APPLY sys.dm_exec_sql_text(qs.sql_handle) qt WHERE qs.total_elapsed_time / NULLIF(qs.execution_count, 0) > 3000000 AND qs.last_execution_time > DATEADD(HOUR, -24, GETUTCDATE()); - Configure DB Connect Input to connect to your database.
- Set the query.
SELECT CAST(query_id AS NVARCHAR(50)) AS query_id, LEFT(query_sql_text, 4000) AS query_sql_text, last_execution_time, avg_duration_ms, max_duration_ms, last_duration_ms, execution_count, total_cpu_time_sec, database_name FROM dbo.SlowQueries WHERE last_execution_time > ? ORDER BY last_execution_time ASC
- Configure the inputs:
- Set Mode: Event
- Type: Rising
- Rising Column: last_execution_time
index="sqlserver-auditlog" sourcetype="sqlserver:slow_queries"
| eval duration_seconds=round(avg_duration_ms/1000, 2)
| table _time, database_name, duration_seconds, execution_count, query_sql_text
| sort - duration_seconds
Next steps
Now that you have learned how to identify database connections in your GCP CloudSQL database, check out the other Lantern articles available for this service:
- Splunk Lantern Article: Examining data definition language operations in GCP CloudSQL
- Splunk Lantern Article: Tracking GCP CloudSQL permission changes
- Splunk Lantern Article: Identifying GCP CloudSQL database connections