Monitoring Snowflake database usage
Snowflake is a popular, managed database that can be used to quickly access private data as well as an extensive collection of publicly available data sources. You need to be able to monitor and troubleshoot data sources and their performance, and answer questions such as:
- Are queries getting blocked or queued?
- Should the size of a Snowflake Warehouse be upgraded?
- Have there been an unusual number of failed logins?
- Why isn’t the service returning data? Has a query changed and started erroring out?
Data required
How to use Splunk software for this use case
By using Snowflake dashboards and detectors in the Splunk Observability Cloud content contributors repository you can get answers to these questions, alert on them, and chart trends of other important usage or performance metrics. Download the files from Github, and then use the configuration examples to help you get set up.
You can use the repository to access:
- 7 Dashboards
- 11 Detectors for common Golden Signals-related and billing concerns
- Configuration examples for getting data from Snowflake into Splunk Observability Cloud through the OSS OpenTelemetry Collector
Dashboards
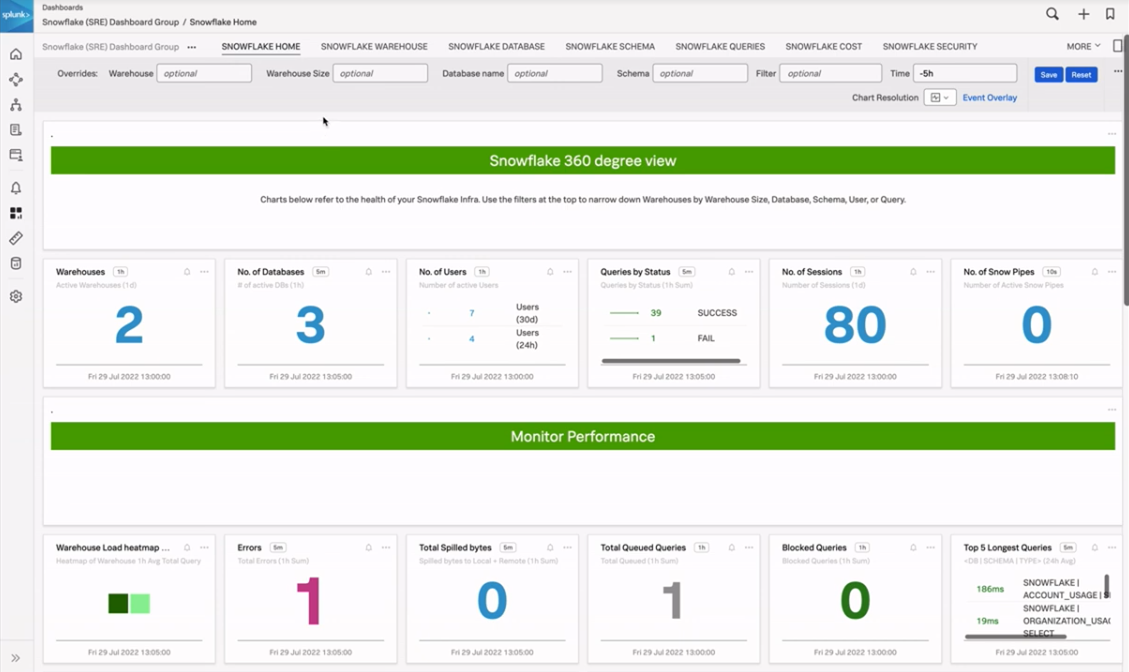
The Snowflake Home Dashboard
The Snowflake Home Dashboard provides you with aggregate overviews of important Snowflake usage metrics like number of warehouses, databases, or users, along with quick summaries of daily cost and total storage usage. This allows you to quickly understand what is going on over your entire Snowflake footprint. In this dashboard the charts shown generally show relevant metrics split by higher-value time periods, such as 24 hours or one hour, to provide you with a high-level understanding that can serve as the starting point for more detailed investigation.
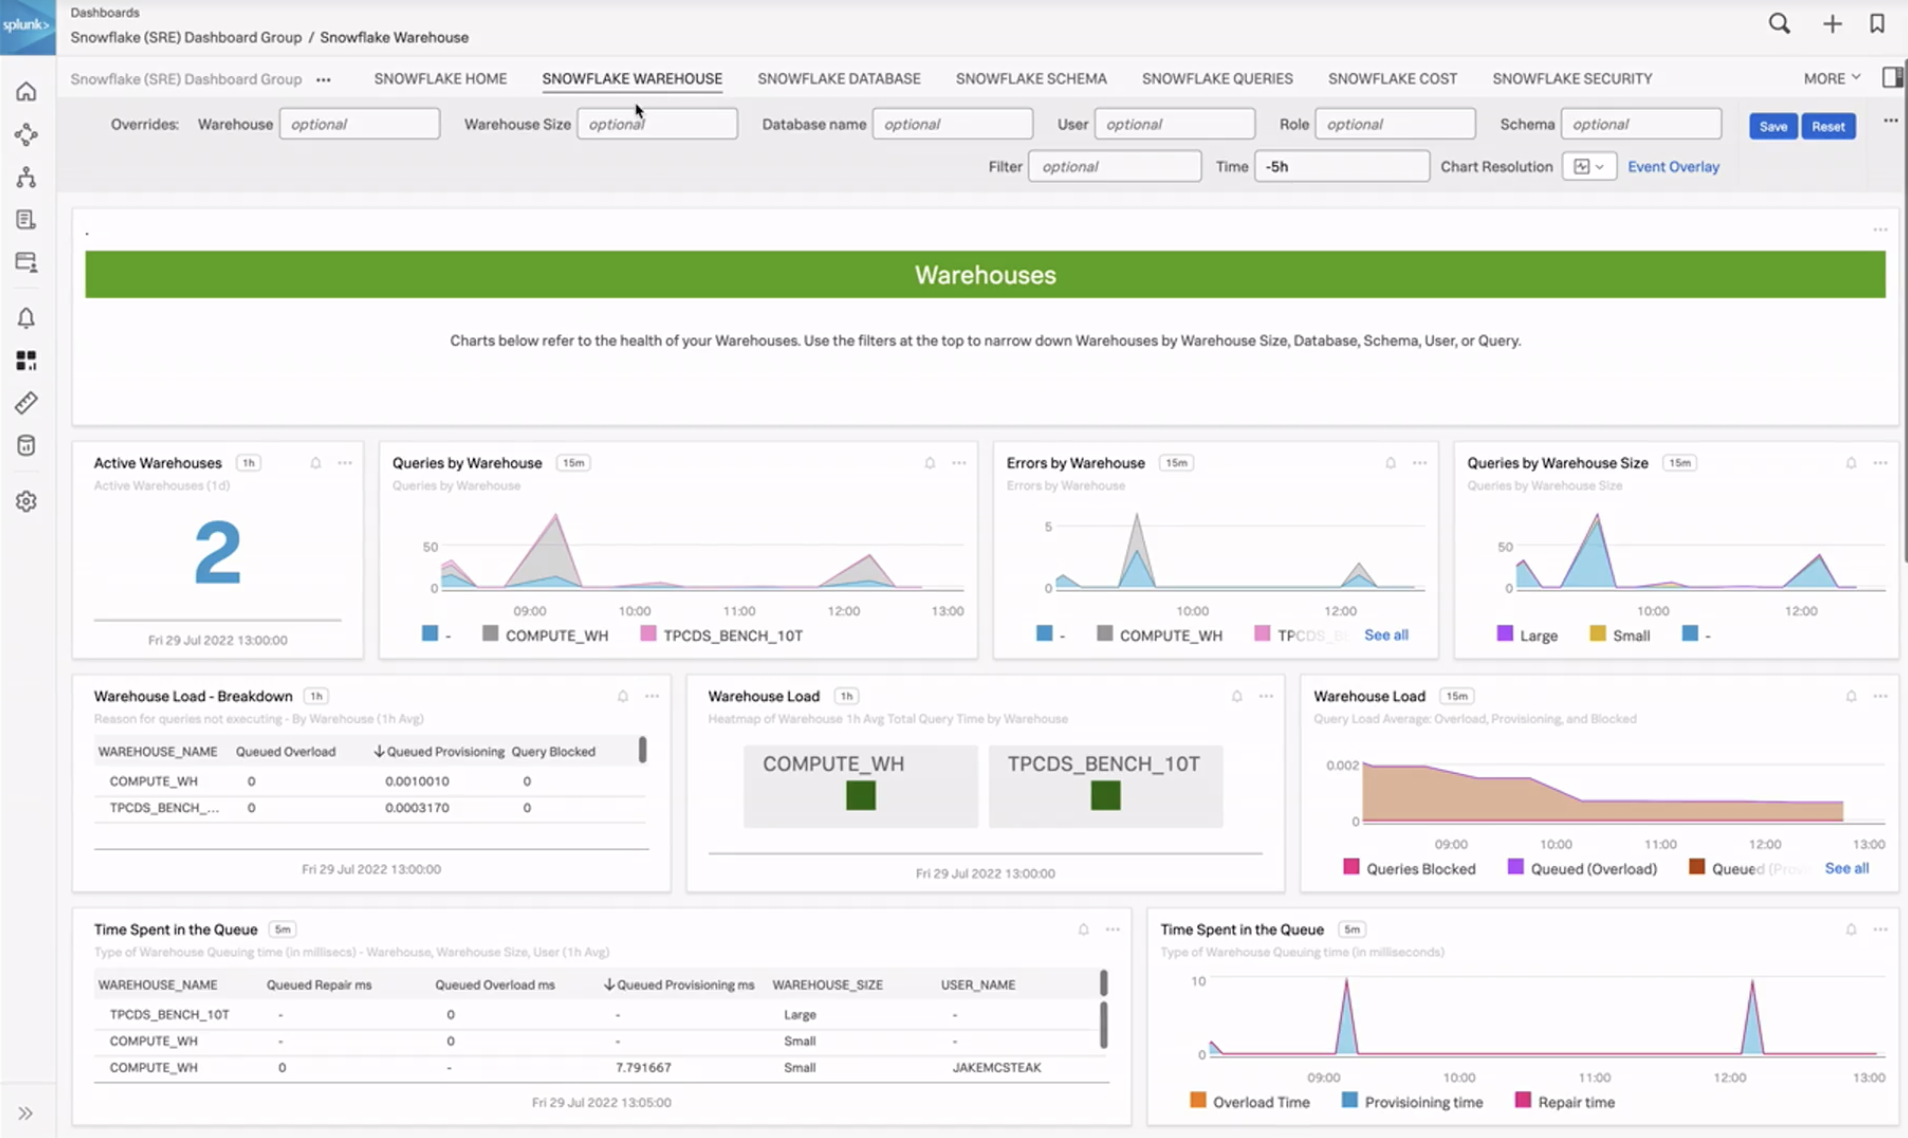
The Warehouse, Database, and Schema dashboards
For more detailed information, you can access other dashboards focused on warehouses, databases, and schemas. These allow you to focus on more specific detail with trends over time to help you identify changes in queries, errors, spilling, queuing, and data ingest.
In the example below, the Snowflake Warehouse dashboard shows queries by warehouses, active warehouses, and errors, including queries by warehouse size. You can use this information to see if you have any small warehouses that are getting too many queries or large warehouses that are getting too few queries, at which point you can make adjustments accordingly.
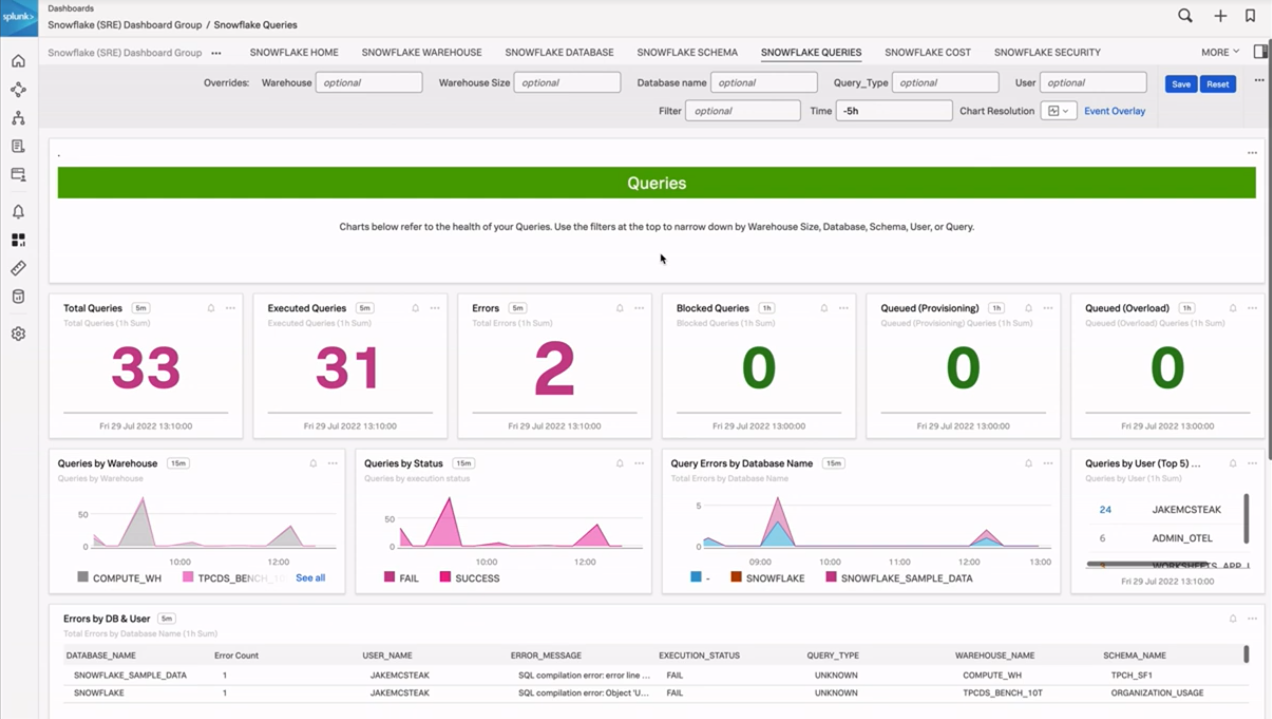
The Queries dashboard
To get even more detail, you can access the Queries dashboard. This shows you how many queries have been run or executed, and queries that are blocked, provisioned, or overloading. The last table on this page shows an error breakdown by database and user, and it also includes the error message and the query type. This can be useful in a few scenarios, for example:
- When you want to find out where the most errors are happening
- If you see a storm of errors and want to find out who or what might be causing it
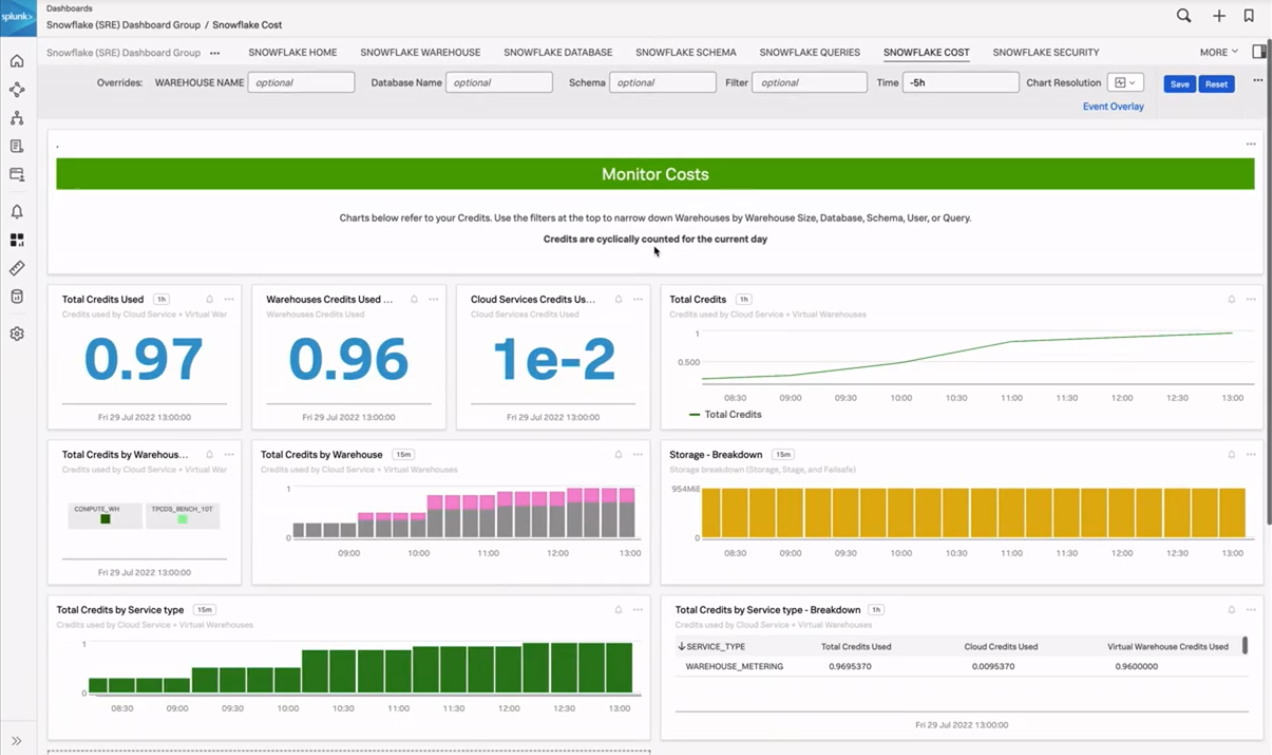
The Cost dashboard
Snowflake credits are cyclically counted for the current day, and this dashboard helps you see how much you have used. You can see the daily credits used for the day and what they're being used on. There is also a table that shows the credit breakdown by service type and where those credits are being spent.
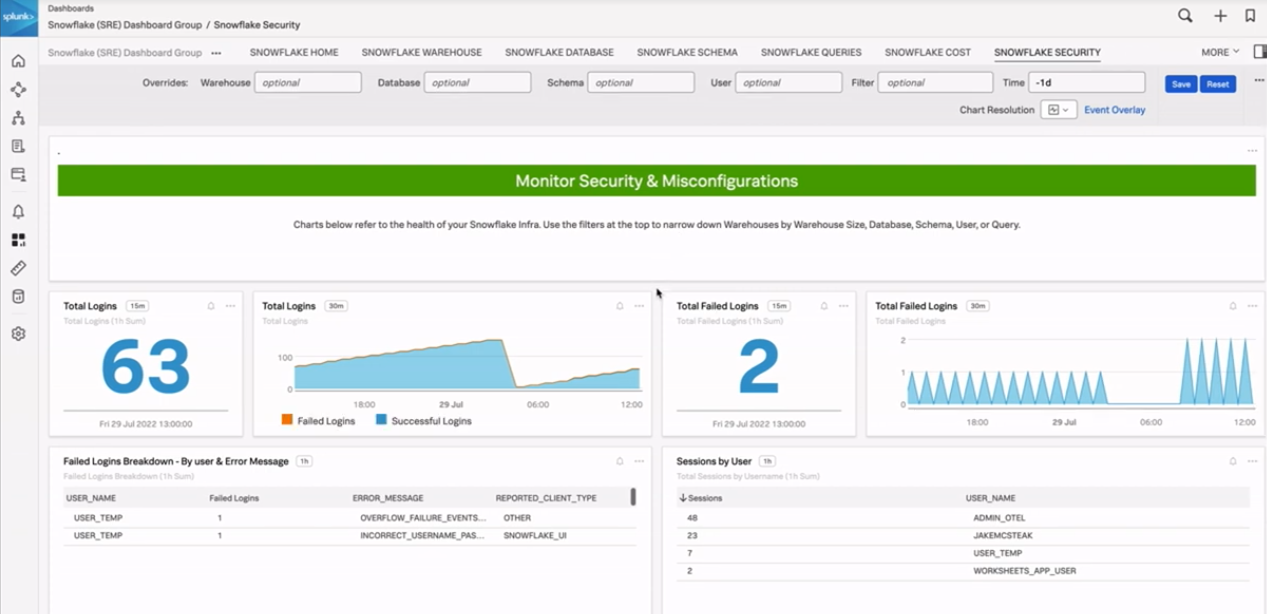
The Security dashboard
This dashboard shows total logins in your environment, failed logins, and sessions split by user. This can help you identify any divergent trends that may need immediate attention.
Detectors
The Golden Signals are helpful metrics to track for various software services. The Detectors for Snowflake provided in the Observability Content Contributor repository follow the Golden Signals pattern of looking at Latency, Errors, Traffic, and Saturation (L.E.T.S.) along with a couple of billing related detectors. These detectors are a helpful head start and can have their thresholds easily adjusted to match expectations in your own environment.
Latency
- Long queries in small / extra-small warehouses (usually a sign you may want to upgrade your Warehouse size)
- Queries taking longer than 15 minutes
Errors
- DB errors total
- DB error rate
- Login failure rate by user
Traffic
- Blocked queries by warehouse
- No queries seen in last X hours
Saturation
- Overloaded queries
- Queries queued for over X seconds
Billing
- Credits used by warehouse anomaly detection
- Warehouses with high cloud services cost
Using these detectors as examples will help you identify what issues might be occurring during an incident, and whether they are related to Snowflake or other elements of your stack.
OpenTelemetry Agent Configuration
Snowflake Receiver (OpenTelemetry Contrib)
agent_config.yamlContains receiver, exporter, pipeline configuration- The receiver entries for Snowflake can be found under
snowflake splunk-otel-collector.confContains referenced variables like snowflake username/password, Splunk Observability Cloud token, etc.
Smart Agent Receiver (Legacy)
agent_config.yamlContains receiver, exporter, pipeline configuration- The receiver entries for Snowflake can be found under
smartagent/sql splunk-otel-collector.confContains referenced variables like snowflake username/password, Splunk Observability Cloud token, etc.snowflake-metrics.yamlContains SQL queries and mappings for Splunk Observability Cloud metrics and dimensions pulling metrics from the SnowflakeSNOWFLAKE/ACCOUNT_USAGEinternal view
Next steps
These resources might help you understand and implement this guidance:
- GitHub: SnowflakeDB
- Splunk Help: About the JDBC Driver for Snowflake