Speeding up root cause analysis with artificial intelligence
Most observability practices suffer from a set of common challenges. These are:
- The more stacks and data you have, the less clarity there is in where an issue stems from.
- You have too many tools and too little insight from those tools.
- The amount of data coming in surpasses the ability of humans to analyze it.
Fortunately, artificial intelligence now alleviates some of these problems. The typical incident work workflow in observability looks like this:
- Incident occurs
- Detect and prioritize: Is there an issue? Is it important?
- Triage and investigate: Where did the incident come from? What should you look at?
- Respond: Who do you call?
- Remediate: How do you fix it?
- Postmortem: What did you learn? How can you improve?
Splunk AppDynamics currently includes AI and machine learning capabilities that help you through steps 3-6, providing the following benefits:
- Faster investigations
- one-click RCA
- more context on your incidents
- guided troubleshooting
- Insight-driven decision making
- Surface and summarize suspected root causes for health rule violations
- Lower learning curve
- Remove knowledge barriers
- Democratize observability
How to use Splunk software for this use case
This article presents two use cases that show how you can benefit from AI in Splunk software to get to the root cause of an issue quickly. Both of these start on the Application Dashboard. On the right side, under the Metrics tab, Events are split into Health Rule Violations Started and Anomalies Started. This is where you'll start your root cause analysis with AI.

How to use Splunk software for this use case
AI troubleshooting agent for health rule violations
A health rule is violated when the health rule processor detects that the health rule's critical or warning condition is true. Traditionally, you would take an average of seven clicks to dig into a health rule violation, clicking into various transactions, filtering, sorting, and reviewing the information before you could determine the root cause. The AI analysis brings that down to one click on the violation in the Application Dashboard.
The analysis screen, as in the sample shown below, provides:
- a summary
- the exact metrics in violation
- suspected root cause
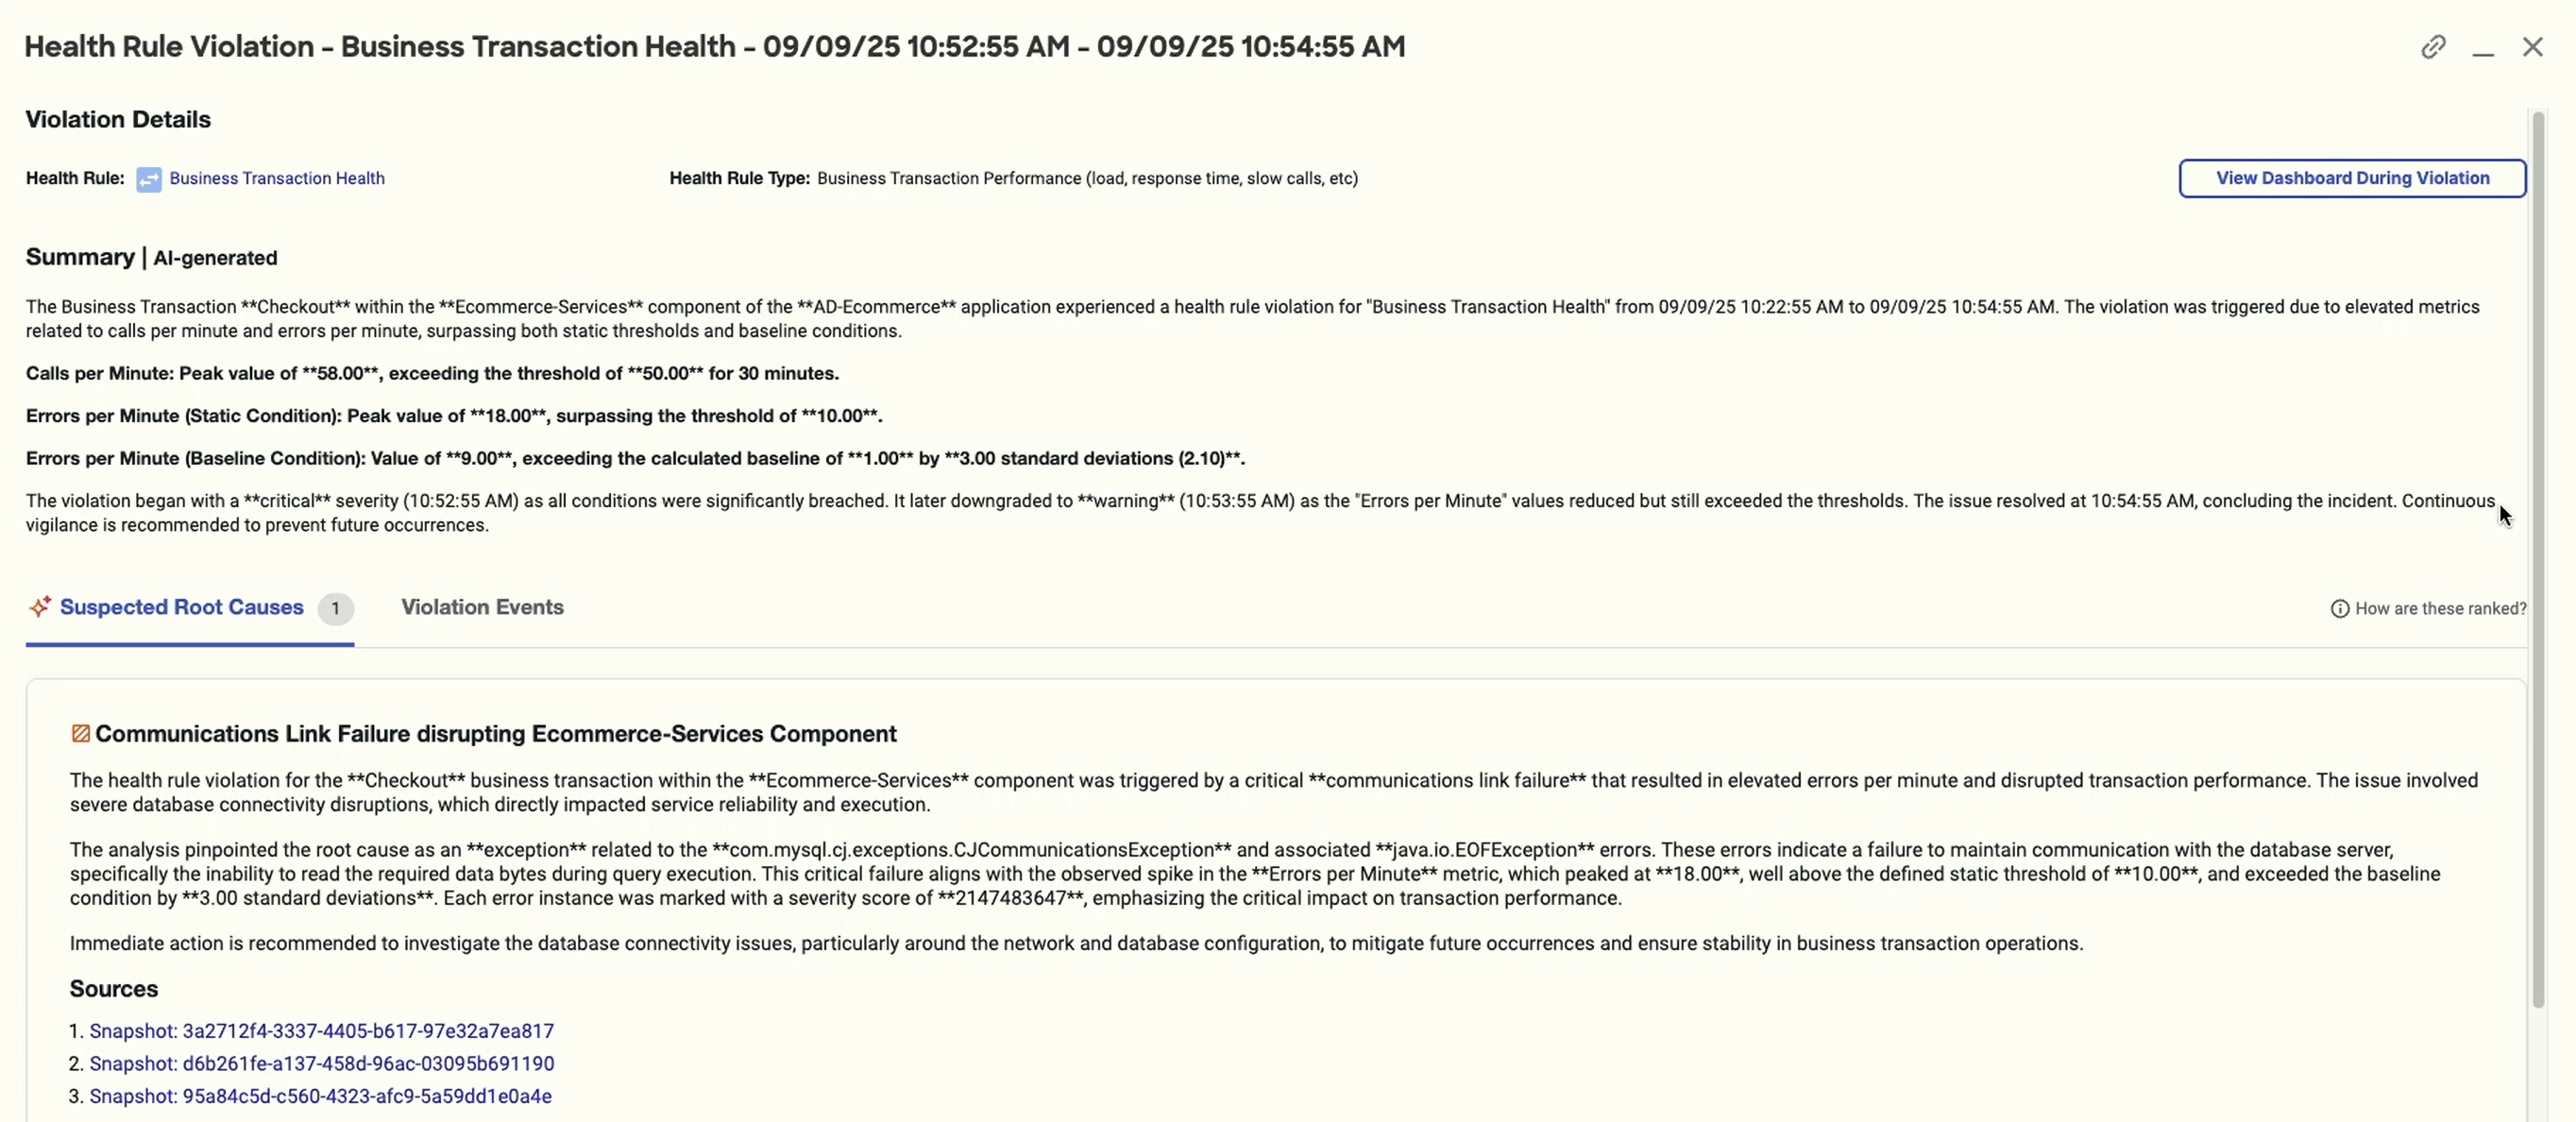
The root cause is really what we're focused on here and, as stated, you learned what it was with one click. From there, you can resolve the issue. The suspected root cause shows snapshots. You can click into any one of those to see individual transactions that experienced the problem. Then, you can click down further into a potential issue to see the Call Graph, which lists the methods in a call stack and provides information about each call.

Note that beneath the title of the violation screen, you can click the name of the health rule to edit it directly. You might find you need to adjust connectors, conditions, expressions, and more.

Also note that you don't have to change your existing workflows to take advantage of this. If you use health widgets in a dashboard, you can scroll down to Widget as List and click on any violation to get to the summarization screen.

AI troubleshooting agent for anomaly detection
As with health rule violations, AI in anomaly detection takes away much of the clicking, sorting and analysis, getting you to root case faster. When you select an anomaly from the Application Dashboard, a screen, like the sample below, opens with the following information.
- Concise AI summary: Receive an AI-generated summary of the issue, with specific times and dates.
- Top deviating metrics: See the exact metrics that created the anomaly, rather than needing to hunt for them yourself.
- Suspected root causes: Review causes ranked in order of probability and paired with a flow diagram that shows where the problem was and where it went.

When you select a root cause, you get similar AI-generated information - a summary, metrics, recommendations, and snapshots - but specifically for that issue.

You can activate this feature with no configuration. Toggle it on at the top left of the Anomaly Detection screen. If you do want to configure severity, sensitivity, or other parameters, you can open the settings from the top left of the screen. Note that this feature needs about 24 hours to train on the data.

Next steps
Now that you have an idea of how Splunk AppDynamics AI can help you conduct root cause analysis more quickly when events occur, watch the full .Conf25 Talk, AI-driven observability. In the talk, you'll learn more about the troubleshooting workflow, the specifics AI features in Splunk AppDynamics and Splunk Observability Cloud, and how anomaly detection and health rules work.
In addition, you might find these Splunk resources helpful:
- Splunk Help: Dynamic baselines
- Splunk Help: Drill into an anomaly
- Splunk Help: Drill into a suspected cause
- Splunk Help: What is root cause analysis?