Deploying and troubleshooting OpenTelemetry successfully
OpenTelemetry offers vendor-agnostic APIs, software development kits (SDKs), agents, and other tools for collecting telemetry data from cloud-native applications and their supporting infrastructure to understand their performance and health. As the open standard to collect telemetry for cloud-native applications to be analyzed by backend platforms like Splunk, OpenTelemetry is about owning and controlling your data, and because of this OpenTelemetry has become widely adopted by many organizations as part of their observability framework for cloud-native software. Additionally, several popular open-source apps and middlewares are shipping with OpenTelemetry instrumentation built in.
Here are some tips to help you quickly and confidently carry out your OpenTelemetry deployment.
While many of these tips are specific to the Splunk Distribution of the OpenTelemetry Collector, they still partially apply to the mainline version of the OpenTelemetry Collector.
Data required
The OpenTelemetry data pipeline
One of OpenTelemetry’s most widely used components is the Collector, an agent that is most commonly run on each host or Kubernetes cluster. The Collector can capture system metrics, data emitted from OpenTelemetry SDKs and other components, and telemetry from other sources like Prometheus and Zipkin clients.
When deploying the OpenTelemetry Collector, planning for the best configuration is essential for a successful deployment. The OpenTelemetry Collector configuration file describes the data pipeline used to collect metrics, traces, and logs. It’s simple YAML, and defines the following:
- Receivers: How to get data in. Receivers can be push or pull-based.
- Processors: What to do with received data.
- Exporters: Where to send received data. Exporters can be push or pull-based.
- Extensions: Provide capabilities on top of the primary functionality of the collector.
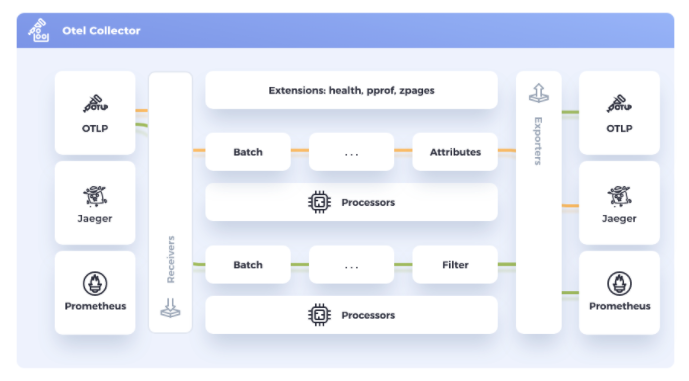
Each of these components is defined within their respective section and then also must be enabled within the service (pipeline) section.
Troubleshooting
Here are some common issues customers can run into when setting up OpenTelemetry pipelines, and how to fix them:
Metrics are not showing the correct deployment environment
Having your deployment environment associated with your workloads can be helpful when trying to narrow down application bottlenecks within multiple environments. There are several ways to ensure your Splunk backend service displays the correct application environment.
Option 1: Include an environmental variable on your host system running the OpenTelemetry Collector
| Platform | Action |
|---|---|
| Linux |
Run this command: export OTEL_RESOURCE_ATTRIBUTES='deployment.environment=ProductionEnv' |
| Kubernetes |
Inject the bold environment variable into the container’s configuration by adding
...
spec:
  template:
    spec:
      containers:
      - env:
        - name: SPLUNK_OTEL_AGENT
          valueFrom:
            fieldRef:
              fieldPath: status.hostIP
        - name: OTEL_EXPORTER_OTLP_ENDPOINT
          value: "http://$(SPLUNK_OTEL_AGENT):4317"
        - name: OTEL_SERVICE_NAME
          value: "<serviceName>"
        - name: OTEL_RESOURCE_ATTRIBUTES
          value: "deployment.environment=ProductionEnv"
        image: my-image
        name: myapp
...
|
| Windows |
Modify the application’s configuration to update the environment: $env:OTEL_RESOURCE_ATTRIBUTES='deployment.environment=ProductionEnv’ |
Option 2: Include the deployment environment as part of the OpenTelemetry configuration file
Use the resource/add_environment processor to add the deployment.environment tag to all captured spans.
The bold text below highlights the addition to the processors section of the configuration file to aggregate ProductionEnv as the specific deployment environment.
processors:
  resourcedetection:
    detectors: [system,env,gce,ec2]
    override: true
  resource/add_environment:
    attributes:
      - action: insert
        value: ProductionEnv
        key: deployment.environment
View and share configuration securely for easy troubleshooting
Extract your running configuration from a host actively running OpenTelemetry Collector by retrieving this URL:
curl http://localhost:55554/debug/configz/effective
You can see that the output redacts secure information like tokens and passwords stored within the configuration file.
exporters:
  logging:
    loglevel: debug
  otlp:
    endpoint: :4317
    tls:
      insecure: true
  sapm:
    access_token: <redacted>
    endpoint: https://ingest.us1.signalfx.com/v2/trace
  signalfx:
    access_token: <redacted>
    api_url: https://api.us1.signalfx.com
    correlation: null
    ingest_url: https://ingest.us1.signalfx.com
    sync_host_metadata: true
  splunk_hec:
    endpoint: https://ingest.us1.signalfx.com/v1/log
    source: otel
    sourcetype: otel
    token: <redacted>
Confirm the OpenTelemetry Collector is collecting data
To confirm the OpenTelemetry Collector is successful in collecting and exporting data, you should use zPages along with the logging exporter. By default, the Splunk OpenTelemetry Collector does not have zPages enabled.
- To enable zPages, navigate to the location of your configuration file:
Platform Action Linux /etc/otel/collector/
Windows \ProgramData\Splunk\OpenTelemetry Collector\agent_config.yaml
- Uncomment the zpages endpoint by removing “#” from the configuration file and restart the OpenTelemetry Collector service to enable the change.
 zpages:
    #endpoint: 0.0.0.0:55679
You should always backup the active configuration file when making changes.
- Using a web browser, navigate to this URL to view actively captured Trace Spans. Alternatively, if you're viewing this on a remote machine, replace “localhost” in the example below with the IP address of the host machine, for example,
http://192.168.86.20:55679/debug/tracezhttp://localhost:55679/debug/tracez
- Select a latency sample associated with one of your enabled exporters to view a snapshot of the data collected by your collector.
- You can also visualize if your collector is collecting and exporting data by enabling the logging exporter. Navigate to the OpenTelemetry collector’s configuration file. In this file, enable the logging exporter as part of your traces and logging pipeline. This example shows where the logging exporter, listed in bold, is added to an existing configuration file:
service: extensions: [health_check, http_forwarder, zpages, memory_ballast] pipelines: traces: receivers: [jaeger, otlp, smartagent/signalfx-forwarder, zipkin] processors: - memory_limiter - batch - resourcedetection - resource/add_environment - attributes/newenvironment exporters: [sapm, signalfx, logging] # Use instead when sending to gateway #exporters: [otlp, signalfx] metrics: receivers: [hostmetrics, otlp, signalfx, smartagent/signalfx-forwarder] processors: [memory_limiter, batch, resourcedetection] exporters: [signalfx] # Use instead when sending to gateway #exporters: [otlp] metrics/internal: receivers: [prometheus/internal] processors: [memory_limiter, batch, resourcedetection/internal] exporters: [signalfx] # Use instead when sending to gateway #exporters: [otlp] logs/signalfx: receivers: [signalfx] processors: [memory_limiter, batch] exporters: [signalfx] # Use instead when sending to gateway #exporters: [otlp] logs: receivers: [fluentforward, otlp] processors: - memory_limiter - batch - resourcedetection - resource/add_environment - attributes/newenvironment exporters: [splunk_hec, logging] - Restart the OpenTelemetry collector service to enable the change.
- Use
journalctlon your Linux hosts or Event Viewer on your Windows hosts to confirm the structure of your collected data. Where you are exporting metrics on a Linux host running the OpenTelemetry collector, usingjournalctl, run the following command to begin viewing exported metrics by the logging exporter:journalctl -u otel-collector -f journalctl -u splunk-otel-collector.service -f (For the Splunk distribution)
The terminal now shows the exported metrics and the corresponding metadata. You can now confirm if the Collector’s configuration and metadata are running as you expect before sending any data to your backend system.
Next steps
The content in this article comes from a previously published blog, one of the thousands of Splunk resources available to help users succeed. In addition, these resources might help you understand and implement this guidance: