Creating cross-domain visibility in campus infrastructure
Wi-Fi is slow in Ottawa today. This is how most campus network incidents begin, not with a monitoring alert and not with a dashboard turning red, but with a user complaint that eventually reaches the help desk. By then, the engineering team is already behind.
Campus networks are inherently cross-domain. Wireless performance depends on wired infrastructure. Wired stability depends on access layer switch health. Access layer health depends on physical connectivity. A problem in any layer propagates upward in ways that only become obvious when you're looking at all of them together. Most monitoring tools don't do this. Cisco Catalyst Center brings AI-driven issue detection and health scoring to the campus, and Splunk takes that signal and puts it in an operational context that drives faster investigation. With adaptive thresholding in Splunk ITSI (ITSI), the signal can fire before users notice the impact.
Prerequisites
Software
This capability is built on a specific set of Splunk apps and Cisco technical add-ons working together:
- Enterprise Network Command Center. This is a private app built on Splunk Enterprise. It correlates Catalyst Center telemetry and wireless health into a single operational view. While this app is not publicly available, this article demonstrates the power of what you can build on the Splunk platform to achieve this use case. The exact SPL for some of the searches is given in this article to get you started. Additional help in building a similar app tailored to your environment is available through the developer documentation or an engagement with Professional Services.
- Cisco Catalyst Add-on. Ingests syslog, NetFlow, and API data from Catalyst Center and IOS-XE devices. The primary integration layer for campus data.
- ITSI Content Pack for Cisco Enterprise Networks. Pre-configured service trees and KPIs for Catalyst Center and Meraki environments. Provides out-of-the-box campus health scoring.
- Splunk ITSI (ITSI). Builds service trees from Catalyst Center KPIs. Adaptive ML-based thresholding detects health score deviations before critical thresholds are crossed.
Telemetry onboarding: Catalyst Center as data hub
| Data source | Integration / TA | Splunk sourcetype |
|---|---|---|
| Network issues and AI baselines | Cisco Catalyst Add-on (Catalyst Center API) | cisco:dnac:issue |
| Device health and AP radio stats | Cisco Catalyst Add-on (Catalyst Center API) | cisco:dnac:devicehealth |
| Client health and experience | Cisco Catalyst Add-on (Catalyst Center API) | cisco:dnac:client cisco:dnac:clienthealth |
| Infrastructure domain health | Cisco Catalyst Add-on (Catalyst Center API) | cisco:dnac:networkhealth |
| Configuration compliance | Cisco Catalyst Add-on (Catalyst Center API) | cisco:dnac:compliance |
| Security advisories (PSIRT) | Cisco Catalyst Add-on (Catalyst Center API) | cisco:dnac:securityadvisory |
| Real-time security events | Catalyst Center event webhook to Splunk HEC | source=http:DNAC_EVENT |
The cisco:dnac:issue sourcetype carries the most operational weight in this dashboard. It tracks network issues from Catalyst Center's AI assurance engine, including flapping problems, radio frequency (RF) interference events, wireless intrusion prevention system (WIPS) alerts, and AI baseline deviation events. This is what powers both the proactive episode detection and the root cause investigation.
Critical KPIs for campus operations
To learn how to set up and manage KPIs in Splunk ITSI, see Overview of creating KPIs in ITSI.
| KPI | What it tells you |
|---|---|
| Campus Health Score | cisco:dnac:networkhealth — composite health across wired, wireless, and routing domains. The top-level service indicator. |
| AP Health Score | cisco:dnac:devicehealth — per-AP health including radio utilization, noise, interference, and reachability. |
| AP Radio Utilization % | cisco:dnac:devicehealth — channel load per radio. Above threshold indicates RF congestion causing throughput degradation. |
| Client Onboarding Score | cisco:dnac:client — weighted score across association, DHCP, and authentication. Drops indicate onboarding failures. |
| Client signal strength indicator (RSSI) and signal-to-noise ratio (SNR) | cisco:dnac:client — signal quality per client. Poor RSSI or low SNR indicates a coverage or interference issue. |
| Interface Input / Output Errors | cisco:dnac:devicehealth — per-port error counters from switch hardware. Key indicator for physical-layer faults. |
| Issue Count (P1-P4) | cisco:dnac:issue — Catalyst Center issue severity. Rising P1/P2 count signals widespread infrastructure impact. |
| AI Baseline Deviation Events | cisco:dnac:issue — Catalyst Center AI flags behavior deviating from learned baselines. Fires before hard thresholds. |
| Configuration Compliance % | cisco:dnac:compliance — golden image adherence and end of existence (EoX) lifecycle status. Drift indicates a potential instability source. |
| PSIRT Advisory Coverage | cisco:dnac:securityadvisory — active CVE advisories mapped to devices in the campus. Risk quantification. |
Operational scenario: Access layer fault degrading wireless
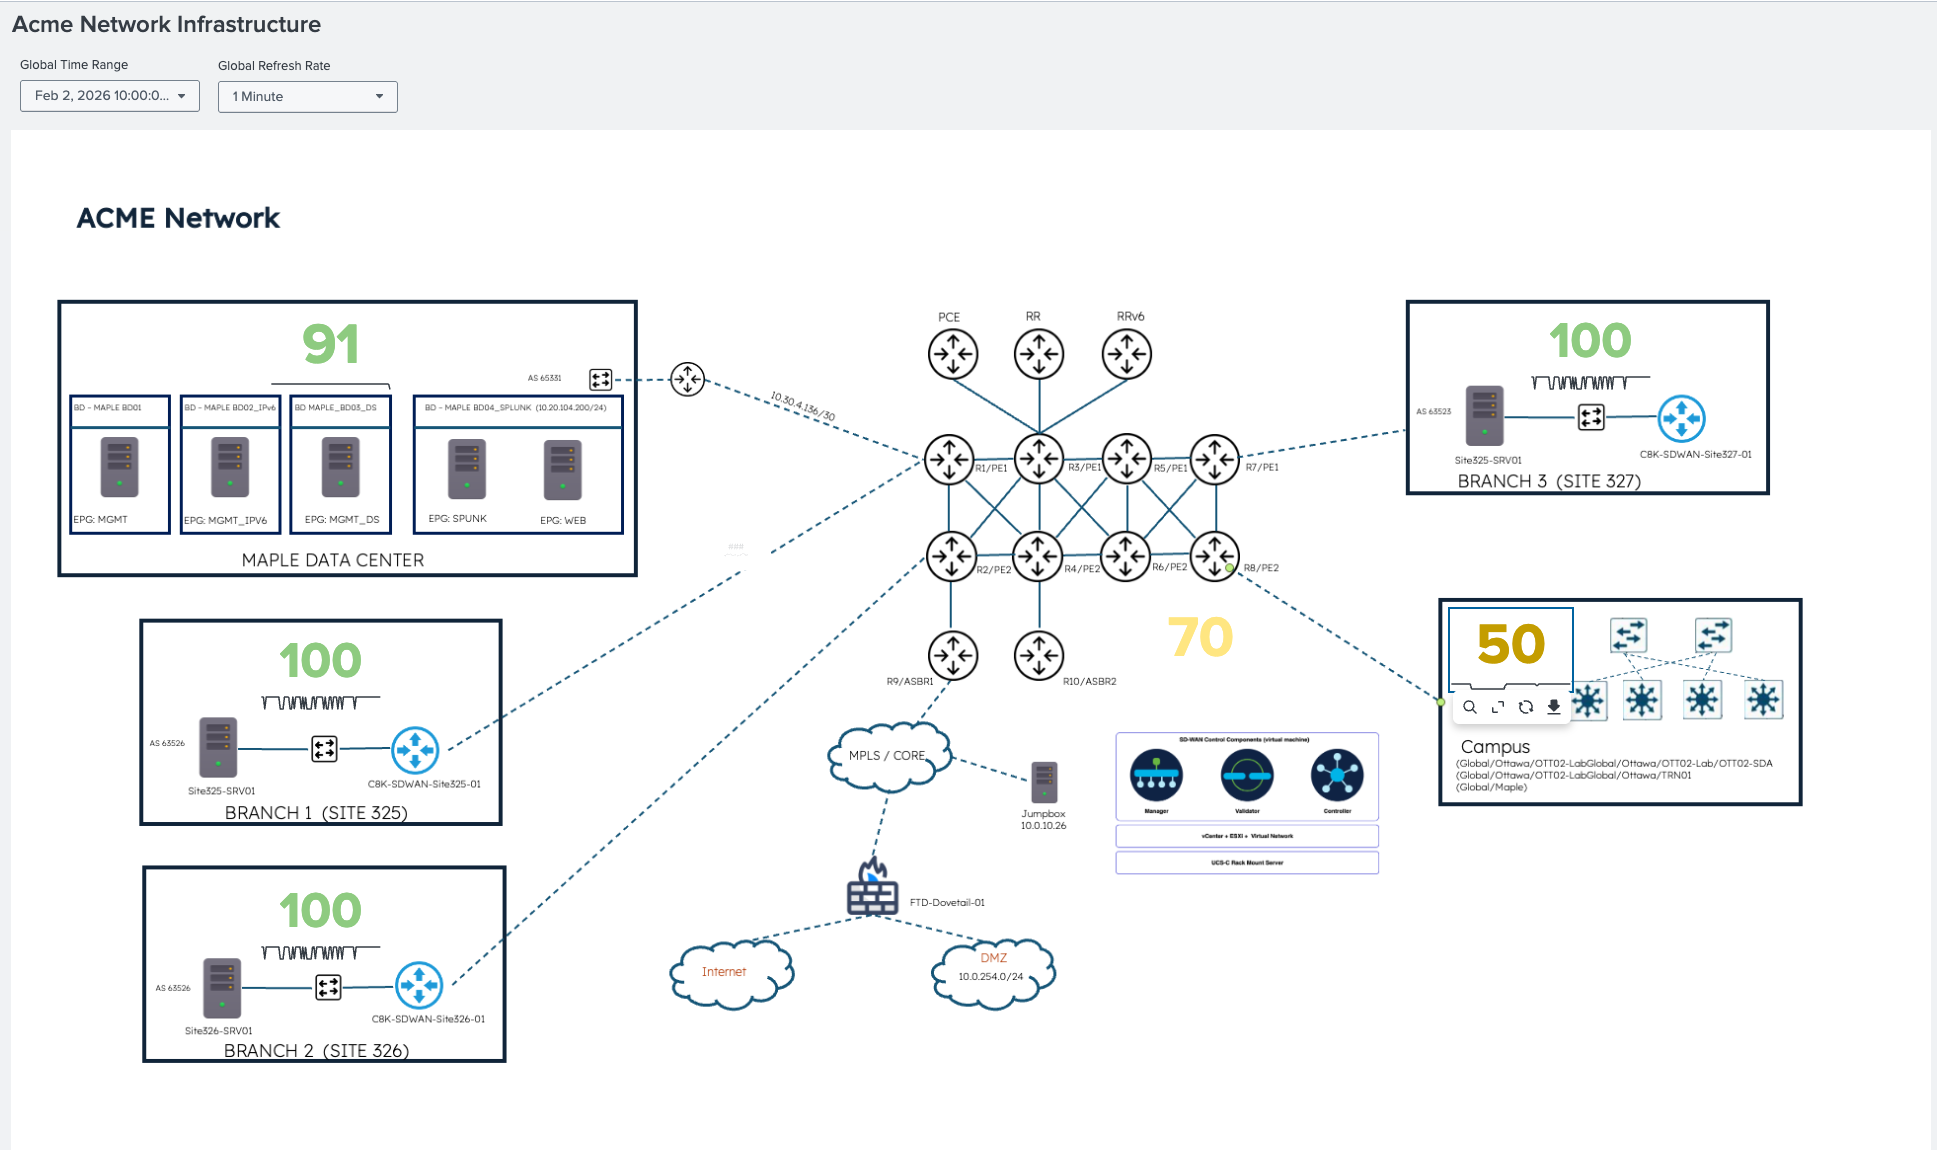
The following ITSI Glass Table shows the campus health score at 50, which means degraded. The data center, branches, and other segments are all healthy. Therefore, the scope is confirmed immediately: this is a campus-specific issue.
Service tree: Knowing which layer before opening an alert
The ITSI service tree for the campus network breaks the composite health score by layer: core, distribution, access, and wireless access points (APs). When the access points are critical and the access and distribution layers are degraded but the core remains healthy, as shown here, the pattern is specific: the issue is in the wired infrastructure supporting the AP layer. It's not RF, not SSID configuration, and not the wireless controller. An entity-level drill-down confirms OTT02-SDA AP as the specific impacted entity. The cisco:dnac:issue metric drives the severity.
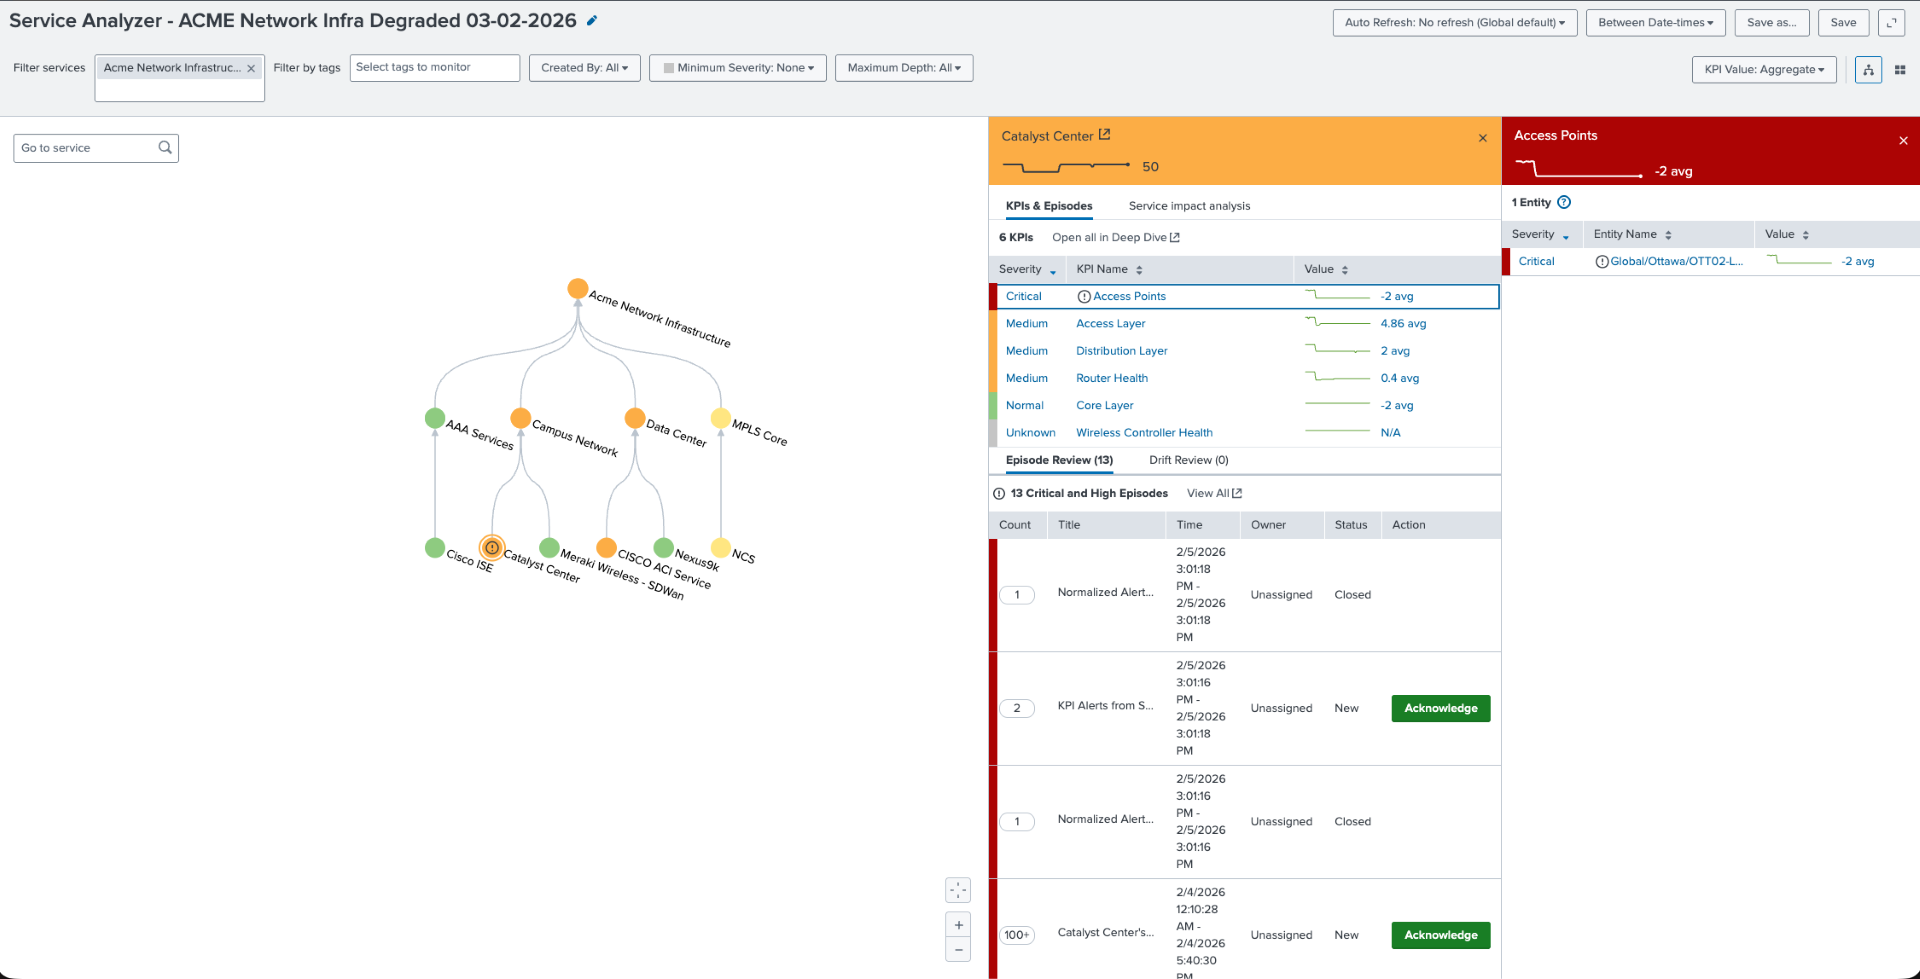
Reading the pattern: Look at the Catalyst Center panel in the upper right. Notice that access is critical, the access layer and distribution are degraded, and the core is healthy. This pattern points directly at problems with the wired infrastructure beneath the APs. When you see this combination in the ITSI service tree, the RF metrics are a red herring; the problem is in the access layer switch infrastructure.
Predictive episode: Alert fires before users notice
Splunk ITSI fires a predictive episode through adaptive thresholding: the campus health score is predicted to drop below 49.93 in the next 30 minutes. This is not a static threshold. The machine learning model has learned the normal health score baseline from cisco:dnac:networkhealth history and detected a statistically significant deviation. The episode fires while the service is still recoverable.
Behind this single episode are multiple contributing signals from cisco:dnac:issue. Interface errors, AP connectivity failures, and AI baseline deviations across two network layers are compressed into one structured incident. Engineers can open one incident instead of a queue of individual alerts.

Finally, this KPI timeline shows the access layer degrading first from cisco:dnac:devicehealth, followed by the distribution from cisco:dnac:networkhealth, and the core is unaffected. The onset timestamp is visible for correlation.

Operations dashboard: Quantifying the impact
The operations command center main dashboard in the Splunk platform shows the following:
- Health score: 45%
- 36 critical issues from
cisco:dnac:issue - 100+ PSIRT advisories from
cisco:dnac:securityadvisory - Layer-specific impact

Drilling into the 36 P1/P2 issues, you can see persistent issue volume trend, not a spike. The availability and connectivity categories are dominant.

The access layer switch shows elevated input/output error counters from cisco:dnac:devicehealth. This confirms the physical root cause of AP uplink instability.

The SPL behind the investigation
The information you will want to display in your Enterprise Network Command Center will vary by devices and topology. Here are some sample searches that you might want to include.
Purpose: Surface P1/P2 issues from Catalyst Center with AI baseline context
`cisco_catalyst_app_index` sourcetype=cisco:dnac:issue cisco_catalyst_host="*" | search IssueSpecificCategory IN ("Availability", "Connectivity", "Security", "Wireless")
 | stats
     latest(_time) AS last_seen,
     latest(IssueName) AS issue_name,
     latest(IssuePriority) AS priority,
     latest(IssueStatus) AS status,
     latest(IssueSpecificSummary) AS summary latest(IssueSpecificCategory) AS category
     BY IssueID, DeviceName
 | convert ctime(last_seen) AS "Last Seen"
 | table "Last Seen", DeviceName, issue_name, priority, status, category ,summary
 | sort -last_seen
 | head 50
 | rename DeviceName AS "Device", issue_name AS "Issue", priority AS "Priority", status AS "Status", summary AS "Details"
Purpose: Wireless client onboarding failures with received RSSI and SNR context
index=campus sourcetype="cisco:dnac:client"
 | where onboardingScore < 3 OR connectionStatus="failed"
 | stats count avg(rssi) AS avg_rssi avg(snr) AS avg_snr BY ssid apName site
 | where count > 5
 | eval signal_quality=case(avg_rssi > -65,"good", avg_rssi > -75,"marginal", true(),"poor")
 | sort -count
Purpose: AP radio health. Detect high utilization and interference from cisco:dnac:devicehealth
`cisco_catalyst_app_index` sourcetype="cisco:dnac:devicehealth" (cisco_dnac_host="*" OR cisco_catalyst_host="*") DeviceFamily="Unified AP"
 | stats avg(UtilizationRadio0) AS u24, avg(UtilizationRadio1) AS u50,
         avg(NoiseHealthRadio0) AS n24, avg(NoiseHealthRadio1) AS n50,
         avg(InterferenceHealthRadio0) AS i24, avg(InterferenceHealthRadio1) AS i50,
         dc(DeviceID) AS count
 | eval data="2.4 GHz,".u24.",".n24.",".i24.",".count."|5 GHz,".u50.",".n50.",".i50.",".count
 | makemv delim="|" data
 | mvexpand data
 | rex field=data "(?<Band>[^,]+),(?<avg_util>[^,]+),(?<avg_noise>[^,]+),(?<avg_interference>[^,]+),(?<ap_count>.+)"
 | eval avg_util=round(coalesce(avg_util,0),1),
        avg_noise=round(coalesce(avg_noise,0),1),
        avg_interference=round(coalesce(avg_interference,0),1),
        ap_count=coalesce(ap_count, 0)
 | table Band avg_util avg_noise avg_interference ap_count
Purpose: Access layer device interface errors. Find the physical root cause
`cisco_catalyst_app_index` sourcetype="cisco:dnac:issue" cisco_catalyst_host="*"
 (IssueSpecificName="*interface*error*" OR IssueSpecificDescription="*interface*error*")
 | eval domain=case(match(DeviceFamily,"(?i)Unified AP|Wireless"), "Wireless",
                    match(DeviceFamily,"(?i)Switches|Switch"), "Wired",
                    match(DeviceFamily,"(?i)Routers"), "Routing",
                    1=1, "Other")
 | search domain="*"
 | rex field=IssueSpecificDescription "interface\s+'(?<interface_name>[^']+)'"
 | stats latest(_time) AS last_seen,
         latest(IssuePriority) AS priority,
         latest(DeviceRole) AS role,
         latest(IssueSpecificSummary) AS summary,
         latest(DeviceName) AS device,
         latest(SiteNameHierarchy) AS site
         by IssueID, interface_name
 | table last_seen, device, role, interface_name, priority, summary, site
 | rename last_seen AS "Last Detected", device AS "Device Name", role AS "Role", interface_name AS "Interface", priority AS "Prio", summary AS "Error Description", site AS "Site Location"
 | convert ctime("Last Detected")
 | sort -priority, -"Last Detected"
Summary: From reactive tickets to proactive assurance
Catalyst Center's AI assurance engine does a lot of the heavy lifting for issue detection within the campus domain. What it doesn't do is correlate those issues with service impact across an enterprise that also includes WAN, data center, and security domains. It also doesn't fire predictive alerts based on learned behavioral baselines that catch problems thirty minutes before they become P1 incidents.
Splunk software takes the rich telemetry from cisco:dnac:issue, cisco:dnac:devicehealth, and cisco:dnac:client and puts it in a service context. The ITSI service tree makes the layer-to-layer dependency explicit. The adaptive thresholding model learns what healthy looks like for your specific campus and fires when something deviates instead of when a generic threshold is crossed.
The goal is simple: fix the access layer switch interface before the user submits the Wi-Fi ticket. Splunk software makes that possible.
Next steps
Ready to learn more about providing network assurance in your organization? Check out the other articles in this series:
- Troubleshooting cross-domain network problems in minutes
- Operating Meraki branch networks at scale
- Assuring enterprise WAN services with Splunk
- Monitoring MPLS backbone infrastructure in real time
- Providing real-time assurance for MPLS-to-SRv6 transitions