Operating Meraki branch networks at scale
Enterprise branch networks are one of the most operationally underserved corners of the infrastructure. Individual sites may run a handful of devices, but at hundreds or thousands of locations, the aggregate complexity is significant. When something goes wrong—a switch port corrupting frames, an AP failing to onboard clients, a VPN tunnel quietly degrading—the first signal is usually a user complaint, not a monitoring alert.
Cisco Meraki simplifies branch management through cloud-based control, but operational assurance across hundreds of sites remains limited. The Meraki Dashboard shows device state. It doesn't show service health across the entire branch estate simultaneously, with contributing factors ranked by impact. That's the gap the Splunk platform fills.
Prerequisites
Software
This capability is built on a specific set of Splunk apps and Cisco technical add-ons working together:
- Meraki NOC Operations Command. This is a custom set of dashboards that provides the unified branch health view: global site overview, alert hub, switching detail, and device 360. While this app is not publicly available, this article demonstrates the power of what you can build on the Splunk platform to achieve this use case. The exact SPL for some of the searches is given to get your started. Additional help in building a similar app tailored to your environment is available through the developer documentation or an engagement with Professional Services.
- Cisco Meraki Add-on / Splunk Streams. Ingests wireless, switching, SD-WAN health, and security events through Meraki Dashboard APIs. Also collects NetFlow from MX appliances.
- Splunk ITSI (ITSI). Aggregates Meraki telemetry into site-level health scores with adaptive thresholding and ML-driven anomaly detection.
Telemetry onboarding: What gets ingested and how
| Data source | Integration / TA | Splunk sourcetype |
|---|---|---|
| Device status and availability | Cisco Meraki Add-on (Dashboard API) | meraki:devices meraki:devicesavailabilitieschangehistory |
| Wireless and AP performance | Cisco Meraki Add-on (Dashboard API) | meraki:accesspoints |
| Switch port operations | Cisco Meraki Add-on (Dashboard API) | meraki:switchportsoverview meraki:switchportsbyswitch |
| Assurance alerts | Cisco Meraki Add-on (Dashboard API) | meraki:assurancealerts |
| SD-WAN / VPN state | Cisco Meraki Add-on (Dashboard API) | meraki:appliancesdwanstatuses meraki:appliancesdwanstatistics |
| Security and threat events | Cisco Meraki Add-on (Dashboard API) | meraki:organizationsecurity meraki:airmarshal |
| Client usage | Cisco Meraki Add-on (Dashboard API) | meraki:summarytopclientsbyusage meraki:summarytopdevicesbyusage |
| NetFlow (Traffic Analysis) | Splunk Streams from MX appliances | stream:netflow |
Critical KPIs and what they reveal
To learn how to set up and manage KPIs in Splunk ITSI, see Overview of creating KPIs in ITSI.
| KPI | What it tells you |
|---|---|
| Site availability % | Derived from meraki:devicesavailabilitieschangehistory — tracks status transitions (Online/Offline) and drives MTTR calculations. |
| Assurance alert severity mix | meraki:assurancealerts — severity levels and category types (Connectivity, Performance). Rising critical count = escalating impact. |
| Switch port CRC error rate | meraki:switchportsbyswitch — port-level error counts. Elevated CRC rate = physical layer corruption (cable, SFP, or port). |
| Switch port link speed mix | meraki:switchportsoverview — link speed distribution (10M through 10G). Mismatches indicate auto-negotiation or hardware problems. |
| Wireless auth failure rate | meraki:accesspoints — SSID-specific authentication failures and disassociation outcomes. |
| VPN peer reachability | meraki:appliancesdwanstatuses — VPN peer status (up/down) and uplink state (Primary/Secondary). |
| VPN throughput (RX/TX kbps) | meraki:appliancesdwanstatistics — per-peer throughput. Drops with peer still up = path degradation. |
| Top clients by bandwidth | meraki:summarytopclientsbyusage — identifies bandwidth-heavy clients that may be causing congestion. |
| Appliance utilization % | meraki:summarytopappliancesbyutilization — hardware resource constraints ranked by utilization. |
| Rogue AP detection | meraki:airmarshal — rogue AP presence with 'wired evidence' flag for high-risk threat classification. |
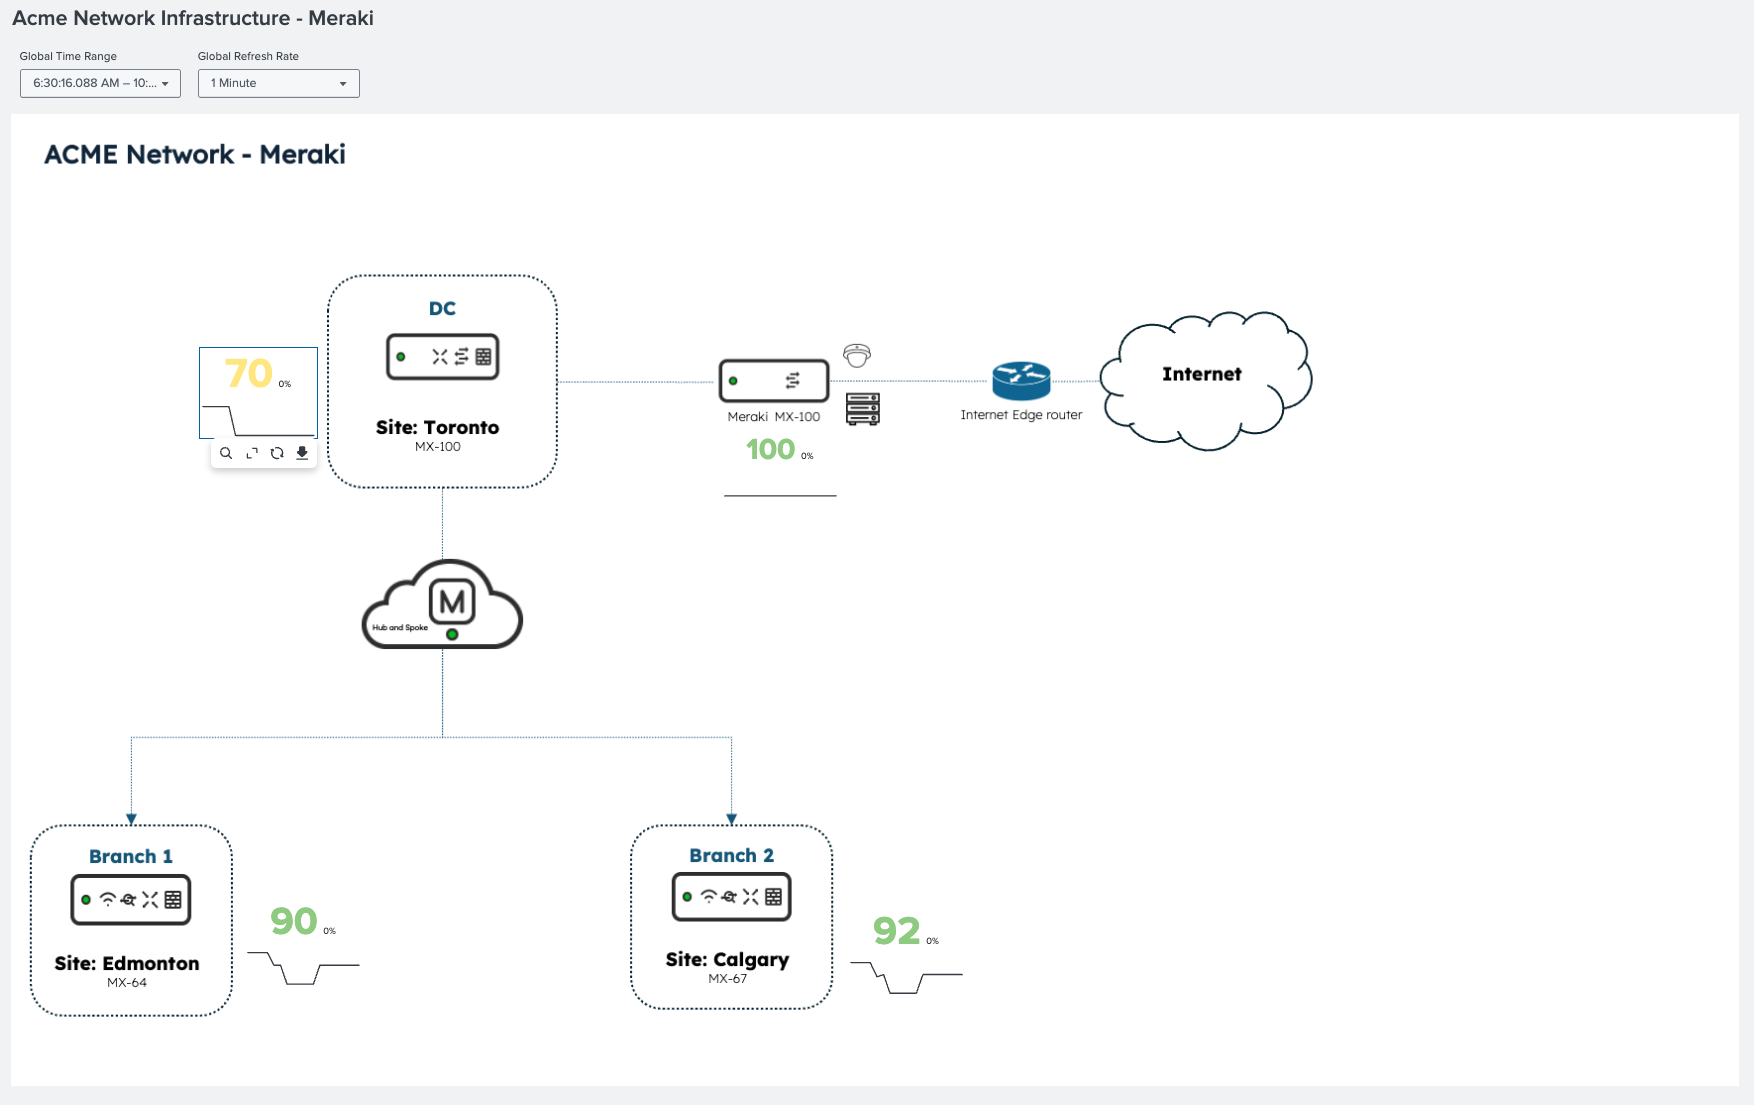
Operational scenario: Cyclic redundancy check (CRC) errors at the Toronto hub
The following diagram shows a Meraki network topology with real-time site health scores. The Toronto site is degrading while all other sites remain healthy, so the scope of the problem is established before any alert is reviewed.
The problem with CRC errors
CRC errors are the most deceptive failure mode in switching infrastructure. A port generating CRC errors doesn't go down; it stays up and passes most traffic, but silently corrupts enough frames to cause TCP retransmissions and application sluggishness. The first symptom is usually 'Wi-Fi feels slow in Toronto today.' The root cause is a physical-layer fault that only surfaces when you're looking at port-level error counters.
The following ITSI service map shows the Toronto Data Center Network service degraded. Through the meraki:assurancealerts metric, the switching faults KPI is highlighted as the primary contributor. Network availability and device health are still green—not yet critical.

Splunk ITSI also shows time-based KPI behavior: connectivity alerts are increasing and switching fault events appear at a specific timestamp. The onset is visible and is critical for correlating with change windows or maintenance activity.

Operations Command Center: Making the impact concrete
In the Splunk platform, the Meraki Operations Command Center shows what the ITSI score reflects in operational terms.
- Network availability is at 70 percent.
- There are multiple active alerts tied to Toronto across connectivity and performance categories.
- Toronto is flagged with the highest alert concentration across the branch estate.
- The alert hub surfaces specific events from
meraki:assurancealertswith severity context.

To see the SPL for select dashboard panels, see the SPL section below.
These panels show active alerts from meraki:assurancealerts. There are CRC errors and configuration alerts for Toronto, and the affected device type and location are identified. CRC errors on switching infrastructure are visible as the dominant alert type.

Root cause confirmed: port 24, C9300-48UXM
The switching tab breaks down incident counts and distribution by port using meraki:switchportsbyswitch data. The top incident is CRC errors on port 24 of the Catalyst C9300-48UXM at Toronto. This is the physical layer: cable, SFP, or port. The affected device and port are identified precisely, and port link speed and error history are visible. Remediation is unambiguous.

These panels show device identity, firmware, active alerts, port configuration (PoE, VLANs, and speed), and full availability history from meraki:devicesavailabilitieschangehistory.

The SPL behind the investigation
Panel: Active Switching Incidents (CRC errors / flaps / loops)
Purpose: CRC error detection across the entire branch estate
index=main sourcetype="meraki:assurancealerts"
 | eval org_id=tostring(organizationId)
 | eval network_id=tostring('network.id')
 | eval network_name='network.name'
 | eval sev=lower(coalesce(alert_severity,severity,"info"))
 | eval device_type=lower(coalesce(deviceType,""))
 | eval resolved_flag=case(isnull(resolvedAt) OR resolvedAt="" OR resolvedAt="null",0,1=1,1)
 | where resolved_flag=0
 | where match(device_type,"switch")
 | eval switch_serial=mvindex('scope.devices{}.serial',0)
 | eval switch_name=mvindex('scope.devices{}.name',0)
 | eval port_id=mvindex('scope.devices{}.portIdentifier',0)
 | eval started_epoch=strptime(startedAt,"%Y-%m-%dT%H:%M:%SZ")
 | eval age_min=round((now()-started_epoch)/60,1)
| table sev network_name switch_name switch_serial port_id type title description startedAt age_min
 | sort 0 -started_epoch
Panel: Active Alerts (Worklist)
Purpose: Assurance alert severity distribution—identify sites with rising critical alert count
index=main sourcetype="meraki:assurancealerts"
 | eval org_id=tostring(organizationId)
 | eval network_id=coalesce('network.id',networkId)
 | eval network_name=coalesce('network.name',networkName)
 | eval sev=coalesce(alert_severity,severity,"info")
 | eval device_name=mvindex('scope.devices{}.name',0)
 | eval device_serial=mvindex('scope.devices{}.serial',0)
 | eval device_mac=mvindex('scope.devices{}.mac',0)
 | eval port_id=mvindex('scope.devices{}.portIdentifier',0)
 | eval resolvedAt_raw=coalesce(resolvedAt, resolved_at, resolved_time)
 | eval resolved_flag=if(isnull(resolvedAt_raw) OR resolvedAt_raw=="" OR resolvedAt_raw=="null" OR resolvedAt_raw=="None", 0, 1)
 | where resolved_flag=0
 | where ("*"="*" OR org_id="*") AND ("*"="*" OR network_id="*") AND ("*"="*" OR sev="*")
 | eval started=strptime(startedAt,"%Y-%m-%dT%H:%M:%SZ")
 | eval age_min=round((now()-started)/60,1)
 | table sev categoryType type title network_name network_id device_name device_serial device_mac port_id startedAt age_min description
 | sort -started
Panel: Active Alerts (This Device)
Purpose: Site availability MTTR from availability change history
index=meraki sourcetype="meraki:devicesavailabilitieschangehistory"
 | eval status_duration=tolong(endTime)-tolong(startTime)
 | stats sum(eval(if(status="offline",status_duration,0))) AS total_downtime_sec
         count(eval(status="offline")) AS outage_events
   BY networkName
 | eval mttr_min=round(total_downtime_sec/max(outage_events,1)/60,1)
 | sort -total_downtime_sec
Panel: SD-WAN / VPN Status (if appliance)
Purpose: VPN peer reachability
index=main sourcetype="meraki:appliancesdwanstatuses"
 | eval network_id=networkId, network_name=networkName, serial=deviceSerial
 | where (network_id="*" OR "*"="*")
 | mvexpand "uplinks{}"
 | eval uplink = 'uplinks{}.interface',
        public_ip = 'uplinks{}.publicIp',
        device_status = deviceStatus
 | stats latest(device_status) AS device_status
         latest(public_ip) AS public_ip
         values(merakiVpnPeers{}.networkName) AS vpn_peers
         values(merakiVpnPeers{}.reachability) AS vpn_reachability
   BY network_name serial uplink
 | sort 0 network_name
What meraki:airmarshal adds: The rogue AP detection source type goes beyond just flagging unknown BSSIDs. When it finds 'wired evidence'—an unknown AP whose MAC is also seen on the wired switching infrastructure—it classifies the rogue as high-risk. This correlation between wireless and switching telemetry is something the Meraki Dashboard shows per-network but Splunk makes searchable across the entire estate in a single query.
Summary: The scale problem that Meraki teams don't talk about
Meraki's cloud-managed model makes individual site management straightforward. Splunk software helps to solve the aggregate operational challenge: when you manage 200 branch sites, how do you know which ones need attention right now? Checking each site's dashboard individually is reactive and doesn't scale.
Splunk provides the answer: a single health score per site, derived from meraki:assurancealerts, meraki:devicesavailabilitieschangehistory, meraki:switchportsbyswitch, and VPN state data, updated continuously. Degrading sites surface automatically. Investigation starts in the right place: the data tells you where to look before users tell you something is wrong.
For distributed enterprises where downtime at a single branch can halt a retail transaction, delay a patient consultation, or stop a logistics operation, that shift from reactive to proactive is measured in real business outcomes.
Next steps
Ready to learn more about providing network assurance in your organization? Check out the other articles in this series:
- Troubleshooting cross-domain network problems in minutes
- Assuring enterprise WAN services with Splunk
- Creating cross-domain visibility in campus infrastructure
- Monitoring MPLS backbone infrastructure in real time
- Providing real-time assurance for MPLS-to-SRv6 transitions