Monitoring MPLS backbone infrastructure in real time
Multiprotocol label switching (MPLS) backbone networks are where everything converges: enterprise WAN paths, carrier customer VPNs, data center interconnects, and cloud on-ramp traffic. When the backbone is unstable, the blast radius is wide and the pressure to resolve quickly is intense.
The monitoring gap is structural. SNMP polling at five-minute intervals was designed for an era when network events were slower than five minutes. Modern Segment Routing MPLS (SR-MPLS) fabrics operating on Cisco NCS 5500 hardware don't fail that slowly. A border gateway protocol (BGP) session flap that recovers in thirty seconds leaves no trace in five-minute SNMP data. An intermediate-system-to-intermediate-system shortest path first (IS-IS SPF) storm that causes a brief forwarding outage is invisible. An MPLS Traffic Engineering (MPLS-TE) fast reroute (FRR) event that completes in under 50ms never appears in a poll cycle.
The data to catch all of these events exists in the router. Getting it into an analytics platform before it's gone is a different engineering problem. Cisco Model-Driven Telemetry solves that problem, and Splunk software turns it into an operational advantage.
Prerequisites
Software
This capability is built on a specific set of Splunk apps and Cisco technical add-ons working together:
- Core Network (MPLS) Operations Command. This is a private app built on Splunk Enterprise. It is an eight-tab operations command center that monitors system resources, interfaces, BGP, IS-IS, MPLS-TE, routing information base (RIB), optics, and forwarding information base (FIB) simultaneously. While this app is not publicly available, this article demonstrates the power of what you can build on the Splunk platform to achieve this use case. The exact SPL for some of the searches is given in this article. Additional help in building a similar app tailored to your environment is available through the developer documentation or an engagement with Professional Services.
- Splunk AI Toolkit. Applies ML-based anomaly detection to high-volume model-driven telemetry (MDT). Detects gray failures and statistical outliers that static threshold alerts miss.
- Cisco MDT input plugin (via Telegraf). Receives gRPC/gNMI streams from NCS 5500 routers. Decodes YANG-structured telemetry and indexes it as structured metrics in Splunk.
Telemetry onboarding: YANG paths, operational domains
| Data source | Integration / TA | Splunk sourcetype |
|---|---|---|
| System resources | Telegraf > HEC > Metrics | MDT: Cisco-IOS-XR-wdsysmon-fd-oper Cisco-IOS-XR-nto-misc-oper Cisco-IOS-XR-shellutil-oper |
| Interfaces | Telegraf > HEC > Metrics | MDT: Cisco-IOS-XR-infra-statsd-oper (input/output errors, drops, rates) |
| BGP | Telegraf > HEC > Metrics | MDT: Cisco-IOS-XR-ipv4-bgp-oper openconfig BGP neighbors GNMI_BGP.session_state |
| IS-IS | Telegraf > HEC > Metrics | MDT: Cisco-IOS-XR-clns-isis-oper (adjacency uptime, SPF stats, hello drops) |
| MPLS-TE | Telegraf > HEC > Metrics | MDT: Cisco-IOS-XR-mpls-te-oper (tunnel availability, FRR coverage, convergence time) |
| RIB | Telegraf > HEC > Metrics | MDT: Cisco-IOS-XR-ip-rib-ipv4-oper (route age, churn, path diversity) |
| Optics | Telegraf > HEC > Metrics | MDT: Cisco-IOS-XR-controller-optics-oper (Tx power, pre-FEC BER, SNR, uncorrected BER) |
| FIB | Telegraf > HEC > Metrics |
MDT: Cisco-IOS-XR-fib-common-oper (routes per VRF, protocol distribution) |
Critical KPIs across eight operational layers
To learn how to set up and manage KPIs in Splunk ITSI, see Overview of creating KPIs in ITSI.
| KPI | What it tells you |
|---|---|
| CPU (5-min avg) % | Cisco-IOS-XR-wdsysmon-fd-oper: total_cpu_five_minute — spikes correlate with control plane instability. |
| Free Physical Memory | Cisco-IOS-XR-nto-misc-oper: free_physical_memory — sustained drops precede process failures. |
| Interface Input/Output Errors | Cisco-IOS-XR-infra-statsd-oper: input_errors / output_errors — non-zero values on backbone links need immediate attention. |
| Interface Input/Output Drops | Cisco-IOS-XR-infra-statsd-oper: input_drops / output_drops — drops indicate congestion or quality of service (QoS) misconfiguration. |
| BGP Session State | GNMI_BGP.session_state — Established/Idle/Active per neighbor. Any non-Established = customer VPN risk. |
| BGP Prefixes Accepted (per VRF) | Cisco-IOS-XR-ipv4-bgp-oper: .../prefixes_accepted — drop in prefix count means customer routes withdrawn. |
| BGP Process Restart Count | Cisco-IOS-XR-ipv4-bgp-oper: .../restart_count — process instability indicator. |
| IS-IS Adjacency Uptime | Cisco-IOS-XR-clns-isis-oper: adjacency_uptime — low uptime means the adjacency is cycling. |
| IS-IS Hello protocol data unit (PDU) Drops | Cisco-IOS-XR-clns-isis-oper: pdu_dropped_count — drops cause adjacency loss and SPF re-convergence. |
| MPLS-TE Tunnels Up | Cisco-IOS-XR-mpls-te-oper: up_p2p_head_tunnels — any drop signals TE path failures. |
| MPLS-TE FRR Coverage | Cisco-IOS-XR-mpls-te-oper: frr_p2p_head_tunnels — percentage with backup path. Below 100% means there is no safety net. |
| TE Convergence Time (ms) | Cisco-IOS-XR-mpls-te-oper: tunnel_total_convergence_complete_time — validates sub-50ms SLA. |
| RIB Route Age / Churn | Cisco-IOS-XR-ip-rib-ipv4-oper: route_modify_time — recent modification timestamps indicate routing instability. |
| Pre‑Forward Error Correction Bit Error Rate (Pre-FEC BER) | Cisco-IOS-XR-controller-optics-oper: pre_fec_ber — signal quality before error correction. Rising value predicts optical failure. |
| Optical signal-to-noise ratio (SNR) (per lane) | Cisco-IOS-XR-controller-optics-oper: snr_lane1 — signal-to-noise ratio. Degradation precedes physical link failure. |
| FIB Routes (per VRF) | Cisco-IOS-XR-fib-common-oper: summary.routes — validates routing intent is programmed in hardware forwarding tables. |
The eight-layer investigation framework
The command center in the Splunk platform validates each infrastructure layer in sequence from physical foundation up to the forwarding plane. Each layer either confirms health (narrowing the problem) or surfaces an anomaly (directing the investigation). The sequence matters: jumping to BGP analysis before confirming that CPU and interfaces are clean is a common MPLS troubleshooting mistake that this layered dashboard prevents.
The first dashboard is System Resources. Here we see CPU (total_cpu_five_minute), memory (free_physical_memory), disk, and uptime across all NCS 5500 routers. Everything is healthy; there is no resource pressure and no process failures.

Next we move to Interfaces. This shows data from input_errors, output_errors, input_drops, output_drops, and bandwidth load per interface. We see zero drops and minimal errors, which means the physical transport layer is clean.

Third is border gateway protocol (BGP) sessions. This is driven by GNMI_BGP.session_state per neighbor, established percentage, and notification rates from openconfig BGP paths. This dashboard can identify session instability before VPN customer impact.

Fourth, the IS-IS (Intermediate System to Intermediate System) dashboard shows metrics from adjacency_uptime, shortest path first (SPF) run count, and pdu_dropped_count from Cisco-IOS-XR-clns-isis-oper. The elevated SPF rate in the panel at the top right signals topology churn in the core.

Fifth is the MPLS-TE dashboard with metrics from up_p2p_head_tunnels, frr_p2p_head_tunnels, and convergence time from Cisco-IOS-XR-mpls-te-oper. Fast reroute (FRR) coverage is shown in the third panel down. Coverage below 100% means that traffic is running without protection.

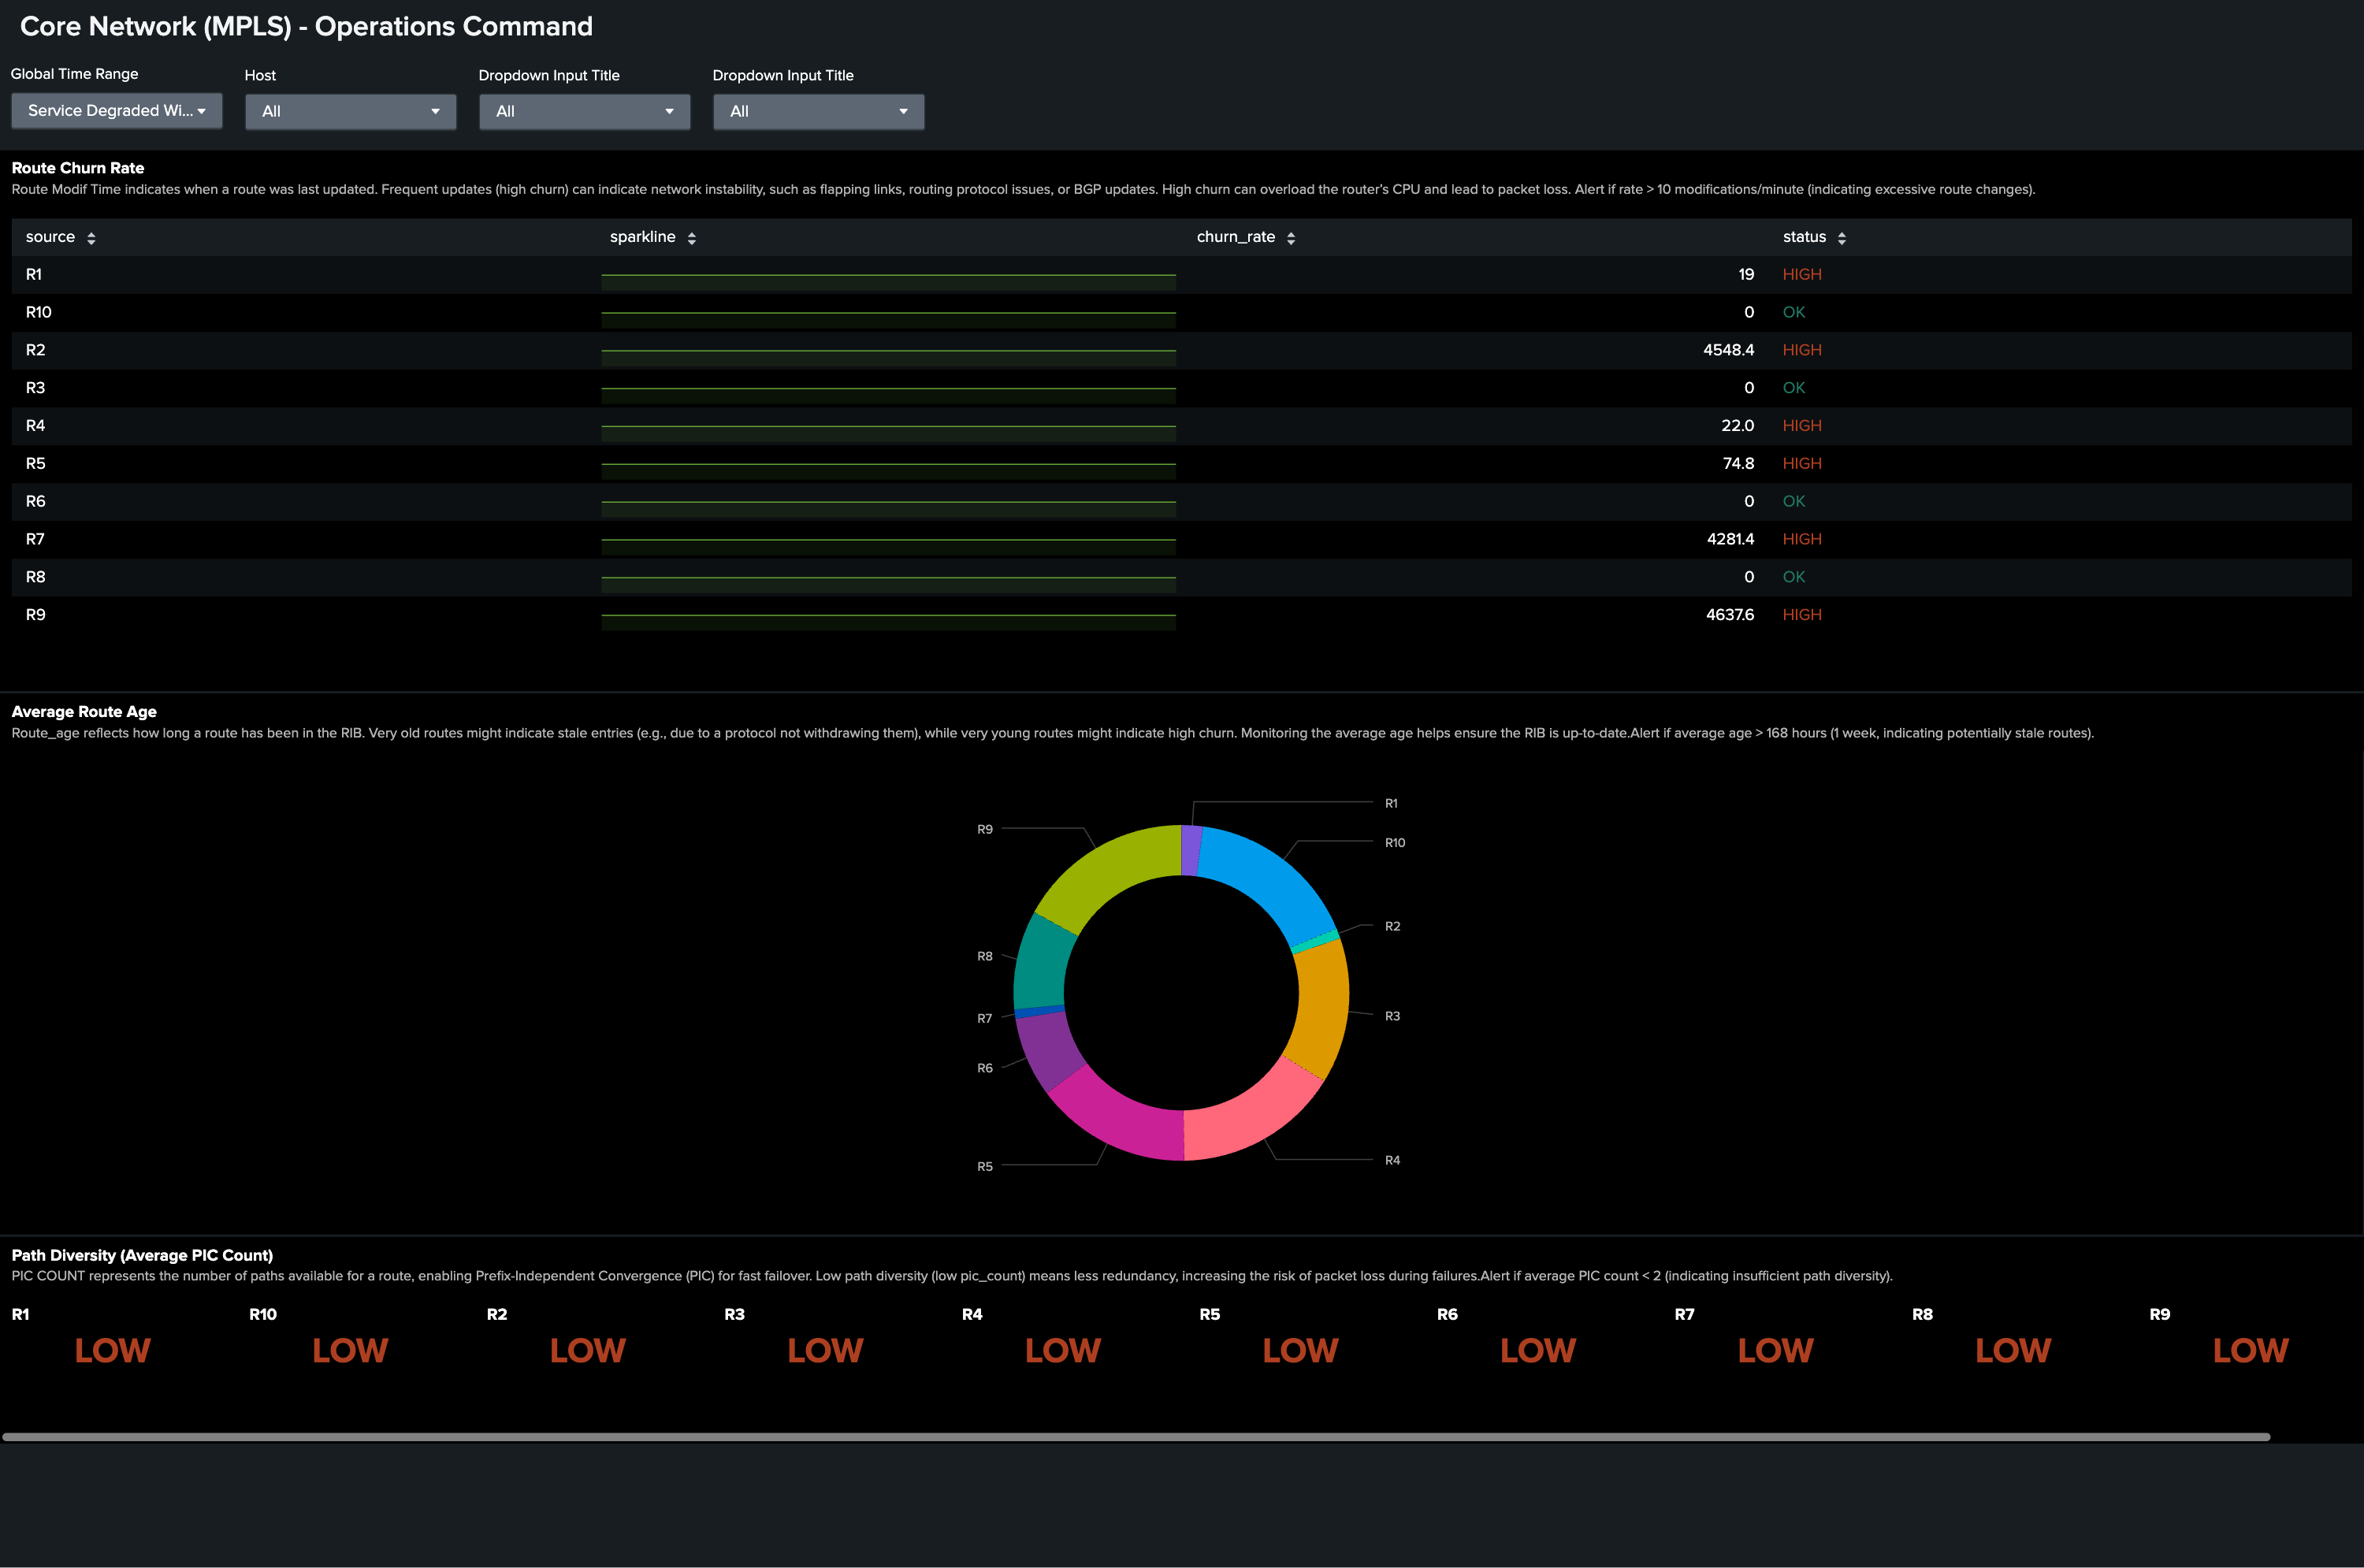
Sixth, the routing information base (RIB) dashboard shows route churn through route_modify_time across routers. The following example shows elevated route churn on multiple routers simultaneously, which signals control plane instability.
Seventh, the Optics dashboard has metrics from pre_fec_ber, snr_lane1, and transmit_power from Cisco-IOS-XR-controller-optics-oper. This dashboard shows a clean baseline, which rules out fiber degradation.

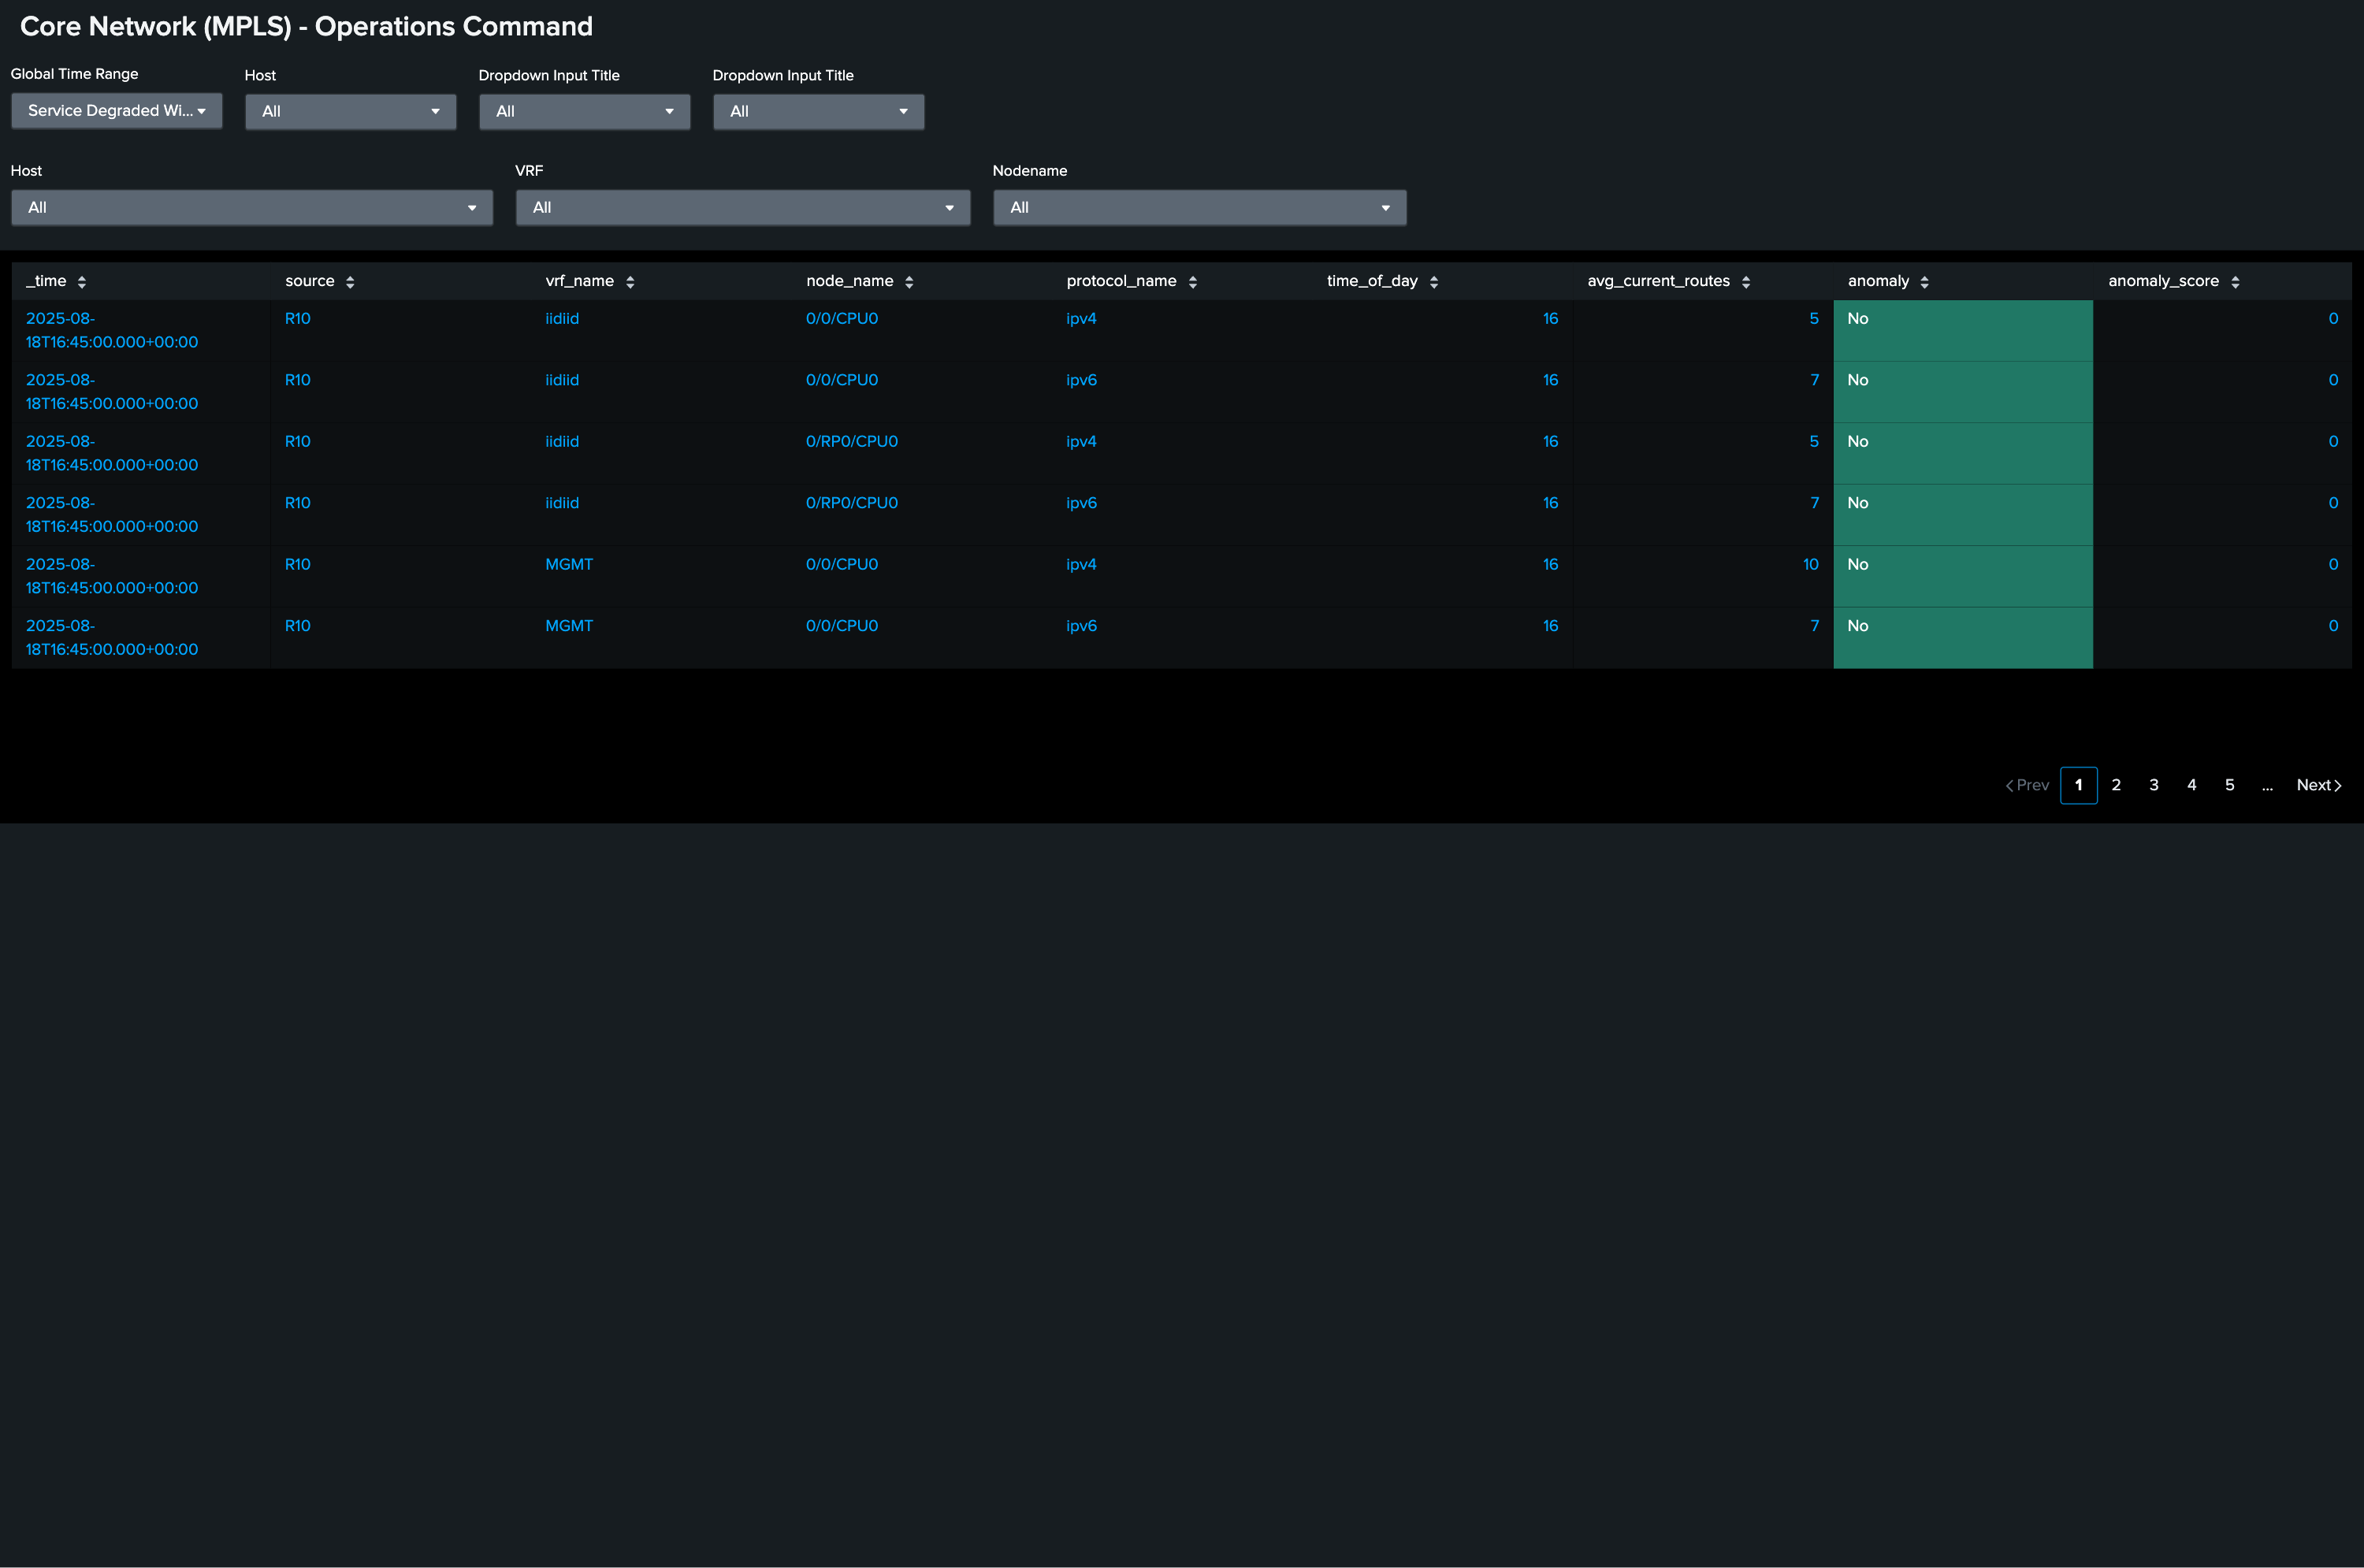
Finally, the forwarding information base (FIB) dashboard shows FIB summary.routes per virtual router or forwarder (VRF). This validates that the hardware forwarding table reflects the routing intent from RIB.
The SPL behind the investigation
The information you will want to display in your Operations Command Center will vary by devices and topology. Here are some sample searches that you might want to include.
Purpose: BGP session state. Any non-established neighbor is a customer VPN risk.
| mstats max("GNMI_BGP.session_state") prestats=true WHERE "index"="cisco_metrics" span=10s BY neighbor_address,source
 | rename psrsvd_nx_GNMI_BGP.session_state as session_state
 | fields _time,source,neighbor_address,session_state
 | table _time,source,neighbor_address,session_state
 | eval bgp_state=case(
     session_state=0, "Idle",
     session_state=1, "Connect",
     session_state=2, "Active",
     session_state=3, "OpenSent",
     session_state=4, "OpenConfirm",
     session_state=5, "Established",
     true(), "Unknown")
 | eval is_alarming_state=if(bgp_state = "Established", 0, 1)
 | eval source_neighbor = source + "_" + neighbor_address
 | timechart span=10s max(session_state) AS max_session_state BY source_neighbor useother=false
Purpose: IS-IS SPF rate. Detect routing instability in the core.
| mstats
     latest("Cisco-IOS-XR-clns-isis-oper:isis/instances/instance/statistics-global.per_area_data/per_topology_data/statistics/spf_run_count") AS spf_count
     WHERE index="cisco_metrics" span=5m BY source
 | delta spf_count AS spf_delta p=1
 | eval spf_rate = if(spf_delta >= 0, spf_delta / 5, 0)
 | eval status = if(spf_rate > 10, "HIGH", "OK")
 | bin span=5m _time
 | stats sparkline latest(spf_rate) AS spf_rate latest(status) AS status BY source
Purpose: MPLS-TE FRR coverage. Surface routers where protection is incomplete.
| mstats
     latest("Cisco-IOS-XR-mpls-te-oper:mpls-te/tunnels/summary.frr_p2p_head_tunnels") AS frr_tunnels
     latest("Cisco-IOS-XR-mpls-te-oper:mpls-te/tunnels/summary.p2p_head_tunnels") AS total_tunnels
     WHERE index="cisco_metrics" span=5m BY source
 | eval frr_coverage = if(total_tunnels > 0, (frr_tunnels / total_tunnels) * 100, 0)
 | eval frr_coverage = round(frr_coverage, 0)
 | eval status = if(frr_coverage < 90, "WARNING", "OK")
 | bin _time span=5m
 | stats sparkline values(frr_coverage) AS frr_coverage values(status) AS status BY source
Purpose: Optical pre-FEC BER trend. Catch fiber degradation before the link drops.
index=cisco_mdt sourcetype="cisco:mdt:optics"
 | eval pre_fec = 'Cisco-IOS-XR-controller-optics-oper:optics-oper/optics-ports/
   optics-port/optics-info.ext_param_val/pre_fec_ber'
 | timechart span=5m avg(pre_fec) AS avg_pre_fec_ber BY host interface
 | where avg_pre_fec_ber > 1e-4
The gray failure that SNMP misses: A 'gray failure' is packet loss without a link-down event: a corruption or partial hardware failure that keeps the interface up while silently dropping frames.input_errors and output_errors from Cisco-IOS-XR-infra-statsd-oper streamed via MDT catch this in real time. SNMP polling at five minutes never sees a gray failure that spikes and recovers between polls. This is one of the most operationally dangerous failure modes in backbone networks, and MDT-to-Splunk is how you find it.
AI Toolkit: Beyond static thresholds
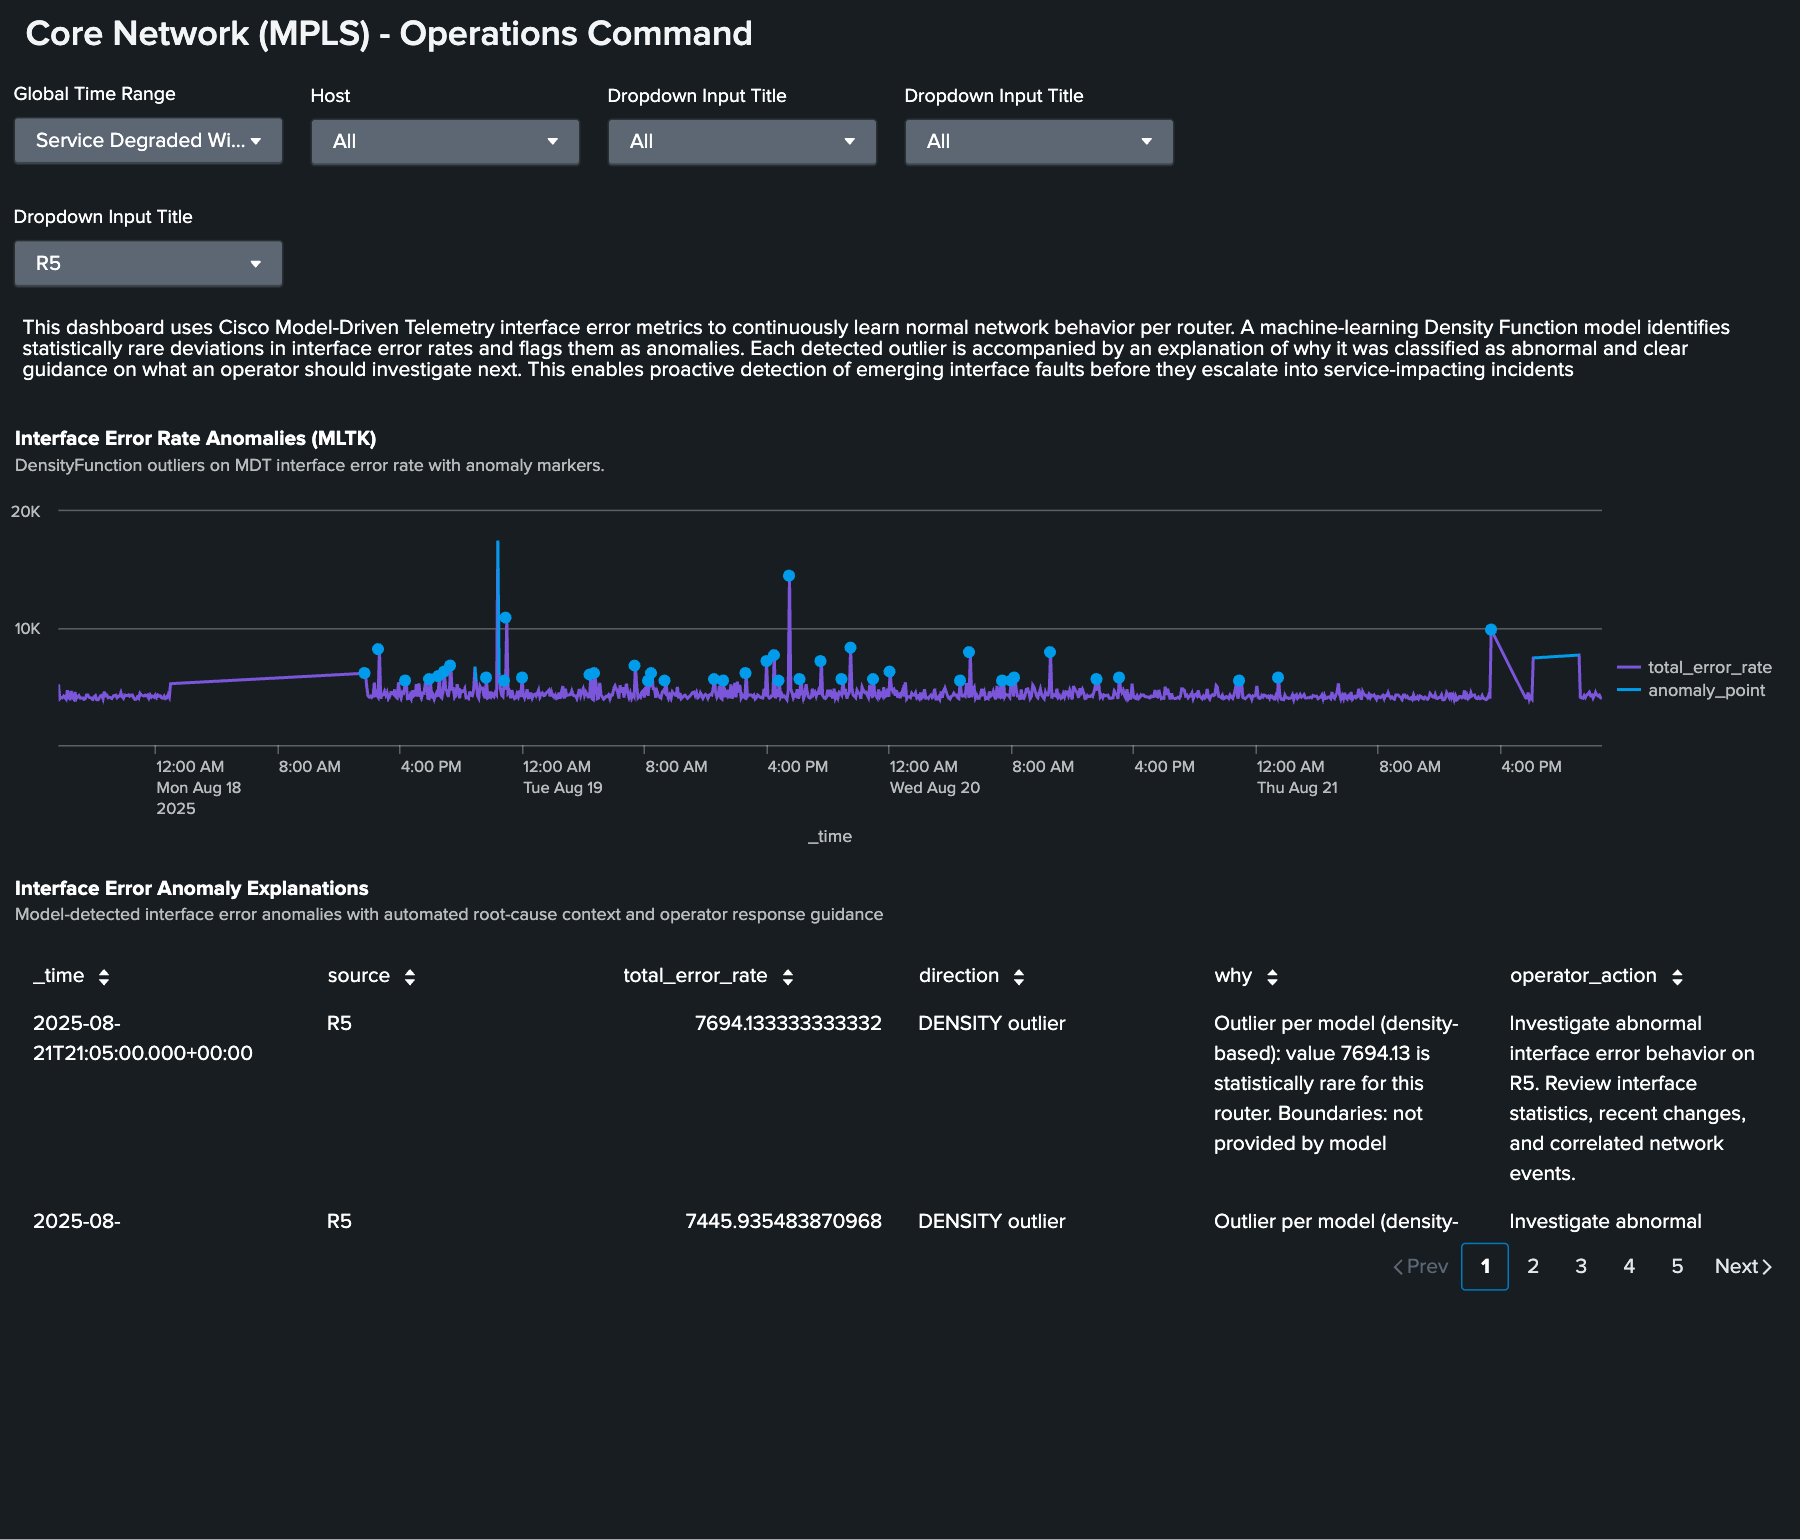
Traffic patterns on backbone infrastructure vary by time of day, day of week, and seasonal demand. A static threshold on interface error rates that works for Tuesday afternoon generates noise on Saturday night when traffic is lighter or misses a genuine anomaly during a traffic surge when everything looks proportional. The Splunk AI Toolkit (AITK) addresses this by building a behavioral model per interface and flagging statistically rare deviations from learned baselines.
Here, the AI Toolkit shows statistical outlier detection on interface error rates. Baseline versus observed behavior is visualized, and anomalies are flagged with severity scoring and investigation guidance.
Summary: What sub-second telemetry changes
Cisco Model-Driven Telemetry pushed at sub-second intervals from NCS 5500 hardware means that the Splunk platform captures events that SNMP can never see: BGP session flaps that recover in thirty seconds, IS-IS SPF storms that cause brief forwarding disruptions, and FRR events that complete in under 50ms. These are not edge cases; they are the transient events that cause intermittent service complaints that never get attributed to a root cause because the evidence disappears before anyone checks.
MDT streamed into Splunk means the evidence is always there. Every convergence event, every error spike, and every session state change is indexed, searchable, and visible in the same platform that shows you the service-level health score for your VPN customers. This is backbone operations done right.
Next steps
Ready to learn more about providing network assurance in your organization? Check out the other articles in this series: