Providing real-time assurance for MPLS-to-SRv6 transitions
Moving a production network from multiprotocol label switching (MPLS) to segment routing IPv6 (SRv6) is not a cutover. It's a transition measured in months or years. SRv6-MPLS interworking allows both forwarding planes to coexist on the same hardware during this period, which is essential for operational continuity. It also introduces failure modes that don't exist in either a pure MPLS or a pure SRv6 environment.
Many possible failure modes keep SRv6 migration engineers up at night. These include:
- Silently reaching hardware ASIC SID limits
- Zombie service identifiers (SIDs)
- Locator age resets
- Flex-Algorithm path compliance failures
These, as well as virtual routing and forwarding (VRF) to segment ID (SID) mapping violations, are invisible to traditional monitoring tools that weren't designed for them. This article describes how the Splunk platform, ingesting Cisco NCS 5500 Model-Driven Telemetry, catches each of these failure modes in real time.
Prerequisites
Software
This capability is built on a specific set of Splunk apps and Cisco technical add-ons working together:
- Core Network (MPLS SRv6) Operations Command Center. This is a private app built on Splunk Enterprise. This is a dedicated operations command center for SRv6 infrastructure: locator stability, SID utilization, data plane compliance, topology flow, border gateway protocol (BGP) service health, forwarding information base (FIB) routes, and Splunk AI Toolkit (AITK) anomaly detection. While this app is not publicly available, this article demonstrates the power of what you can build on the Splunk platform to achieve this use case. The exact SPL for some of the searches is given to get you started. Additional help in building a similar app tailored to your environment is available through the developer documentation or an engagement with Professional Services.
- Cisco MDT input plugin (through Telegraf). Decodes SRv6-specific YANG paths from Cisco-IOS-XR-segment-routing-srv6-oper and indexes them as structured metrics alongside standard system and BGP telemetry.
Telemetry onboarding: SRv6-specific YANG paths
| Data source | Integration / TA | Splunk sourcetype |
|---|---|---|
| SRv6 locator info | Telegraf > HEC > Metrics | MDT: Cisco-IOS-XR-segment-routing-srv6-oper srv6/active/locators/locator/info (sids_count, algorithm_id, age_in_nano_seconds) |
| SID state and function | Telegraf > HEC > Metrics | MDT: Cisco-IOS-XR-segment-routing-srv6-oper srv6/active/locator-all-sids (sid_functionvalue: in-use, stale, pending, delete) |
| SID age and stability | Telegraf > HEC > Metrics | MDT: Cisco-IOS-XR-segment-routing-srv6-oper locator-all-sid.create_timestamp age_in_nano_seconds |
| BGP SRv6 L3 services | Telegraf > HEC > Metrics | MDT: Cisco-IOS-XR-ipv4-bgp-oper prefix_sid_srv6_layer3_svc_count prefix_sid_srv6_layer3_svc_memory |
| BGP SRv6 L2/EVPN services | Telegraf > HEC > Metrics | MDT: Cisco-IOS-XR-ipv4-bgp-oper prefix_sid_srv6_layer2_svc_count prefix_sid_srv6_layer2_svc_memory |
| FIB routes per VRF | Telegraf > HEC > Metrics | MDT: Cisco-IOS-XR-fib-common-oper fib/nodes/node/protocols/protocol/vrfs/vrf/summary.routes |
| BGP session state | Telegraf > HEC > Metrics | MDT: openconfig BGP / GNMI_BGP.session_state bgp_status.session_state, last_established, peer_as |
| Interface and NPU health | Telegraf > HEC > Metrics |
MDT: Cisco-IOS-XR-infra-statsd-oper interface_generic_counters (bandwidth, errors, drops, load) |
Critical KPIs for SRv6 operations
To learn how to set up and manage KPIs in Splunk ITSI, see Overview of creating KPIs in ITSI.
| KPI | What it tells you |
|---|---|
| SID Count Per Locator | Cisco-IOS-XR-segment-routing-srv6-oper: sids_count — total SIDs allocated. Must be tracked against the 16,000-SID NCS 5500 ASIC limit. |
| SID Function State | srv6/active/locator-all-sids: sid_functionvalue — in-use is healthy; stale or pending indicates zombie SID candidates. |
| Locator Age (Nanoseconds) | srv6/active/locators/locator/info: age_in_nano_seconds — near-zero value indicates a locator reset (silent process restart). |
| Flex-Algo ID Per Locator | srv6/active/locators/locator/info: algorithm_id — 0=Best-Effort, 128=Low-Latency. Validates correct Flex-Algo assignment per service. |
| BGP L3 SRv6 Service Count | Cisco-IOS-XR-ipv4-bgp-oper: prefix_sid_srv6_layer3_svc_count — number of L3VPN services running over SRv6 transport. |
| BGP L2/EVPN SRv6 Service Count | Cisco-IOS-XR-ipv4-bgp-oper: prefix_sid_srv6_layer2_svc_count — number of EVPN services. An unexpected drop equals a service withdrawal. |
| BGP Session State (per peer) | GNMI_BGP.session_state / bgp_status.session_state — non-Established means SRv6 transport failure for that VPN service. |
| FIB Routes (Per VRF) | Cisco-IOS-XR-fib-common-oper: fib_summary.routes — per-VRF prefix count in hardware. Drops signal upstream domain events (e.g., ACI BD withdrawal). |
| Interface Bandwidth Load | interface_generic_counters.input_load / output_load — bandwidth utilization on 40G/100G NPU interfaces. |
| BGP RIB Path Scale | Cisco-IOS-XR-ipv4-bgp-oper: path_attributes_entry_count — total path scale in BGP RIB. Growth rate tracks SRv6 migration progress. |
The SRv6 topology

This is an example primary dashboard for an MPLS-SRv6 Operations Command Center. It shows BGP SRv6 service density (L3 and L2 service counts), Service-to-VRF Audit with SID-to-VRF Table ID mappings, and a VRF Route Leak Audit panel.

Failure mode 1: Silent SID hardware exhaustion
The Cisco NCS 5500 ASIC enforces a hard limit of 16,000 segment IDs. When this ceiling is reached, the hardware stops programming new SIDs in the forwarding table without generating an alarm. Traffic using those SIDs is silently dropped. There is no native IOS-XR alert for this condition.
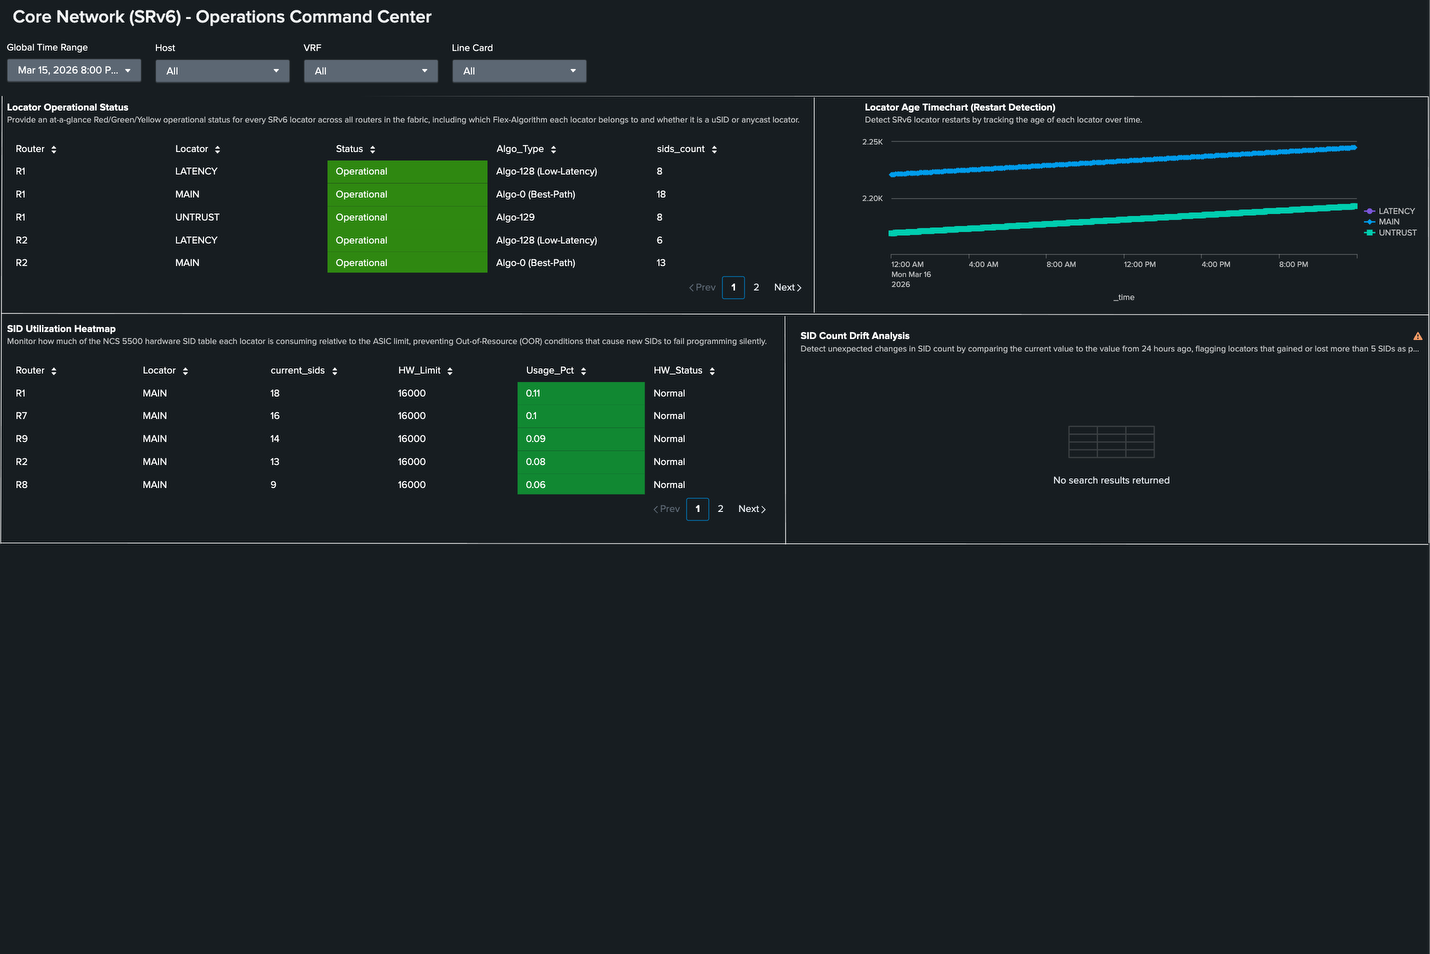
The Splunk platform catches this by continuously tracking sids_count per locator against the known hardware limit, displayed as a utilization heatmap per router. In the dashboard below, the SID Utilization Heatmap panel shows R1 as 0.11% utilization—18 SIDs out of 16,000—well below the limit. As the migration progresses and more services are moved from MPLS to SRv6, the heatmap makes growth visible before the limit becomes a problem. Additionally, the Locator Age Timechart shows continuous uptime (no resets).

Hardware guardrail with no native alarm: The NCS 5500 does not alert when the 16,000-SID ASIC limit is reached. It silently stops programming SIDs. Proactive telemetry-based monitoring through Cisco-IOS-XR-segment-routing-srv6-oper: sids_count is the only way to prevent silent forwarding black-holes from SID exhaustion. This is a monitoring requirement, not an optional enhancement.
Failure mode 2: Zombie SIDs
Zombie SIDs appear correctly configured in software. They are visible in show commands and present in the YANG operational state with sid_functionvalue returning a value, but they haven't been successfully programmed into the hardware forwarding table. This causes several problems:
- Traffic forwarded to a zombie SID is silently dropped.
- No IOS-XR alarm fires.
- SNMP does not detect it.
Detection requires cross-correlating the software SID state (sid_functionvalue: in-use vs. stale/pending) with the hardware FIB programming. When an SID is in-use in software but absent from the FIB routes, the Splunk platform flags it as a zombie. In the dashboard below, Router R1 has a Zombie SID alert at CRITICAL severity — a finding that would be invisible without this cross-layer validation.
Additionally, in the TI-LFA (Topology-Independent Loop-Free Alternate) Resiliency Score panel, we see a score of 100%, which means the backup path is ready for a sub-50ms failover. Finally, we see the per-router compliance status from srv6/active/locator-all-sids data.

Failure mode 3: Locator Age Resets
The SRv6 locator age, tracked via create_timestamp/age_in_nano_seconds in Cisco-IOS-XR-segment-routing-srv6-oper, measures the time since the locator was last established. A sudden drop in locator age to near-zero indicates that the locator process has restarted. This silent event can make all SIDs under that locator temporarily unreachable while the process re-initializes.
The Locator Age Timechart panel makes this immediately visible: a healthy locator shows steadily increasing age. A drop to near-zero is an anomaly that warrants immediate investigation, even if no other alarm has fired.
Failure mode 4: Flex-Algorithm Path Compliance
The Flex-Algorithm 128 in this environment is configured for low-latency path optimization. Traffic using Algo 128 should always follow the path with the minimum accumulated delay metric. When a router loses its Flex-Algo topology database, due to a process restart or a missing intermediate-system-to-intermediate-system (IS-IS) Flex-Algo advertisement, traffic can silently fall back to the standard interior gateway protocol (IGP) path, which violates latency SLAs.
The SRv6 Topology Flow panel in the dashboard below displays a Sankey diagram derived from live FIB data. It shows actual traffic paths through the fabric. This makes Flex-Algo compliance visual: premium traffic following Algo 128 is traceable from the source router through each hop to the destination, confirming that the intended low-latency path is being used.

Additional dashboards
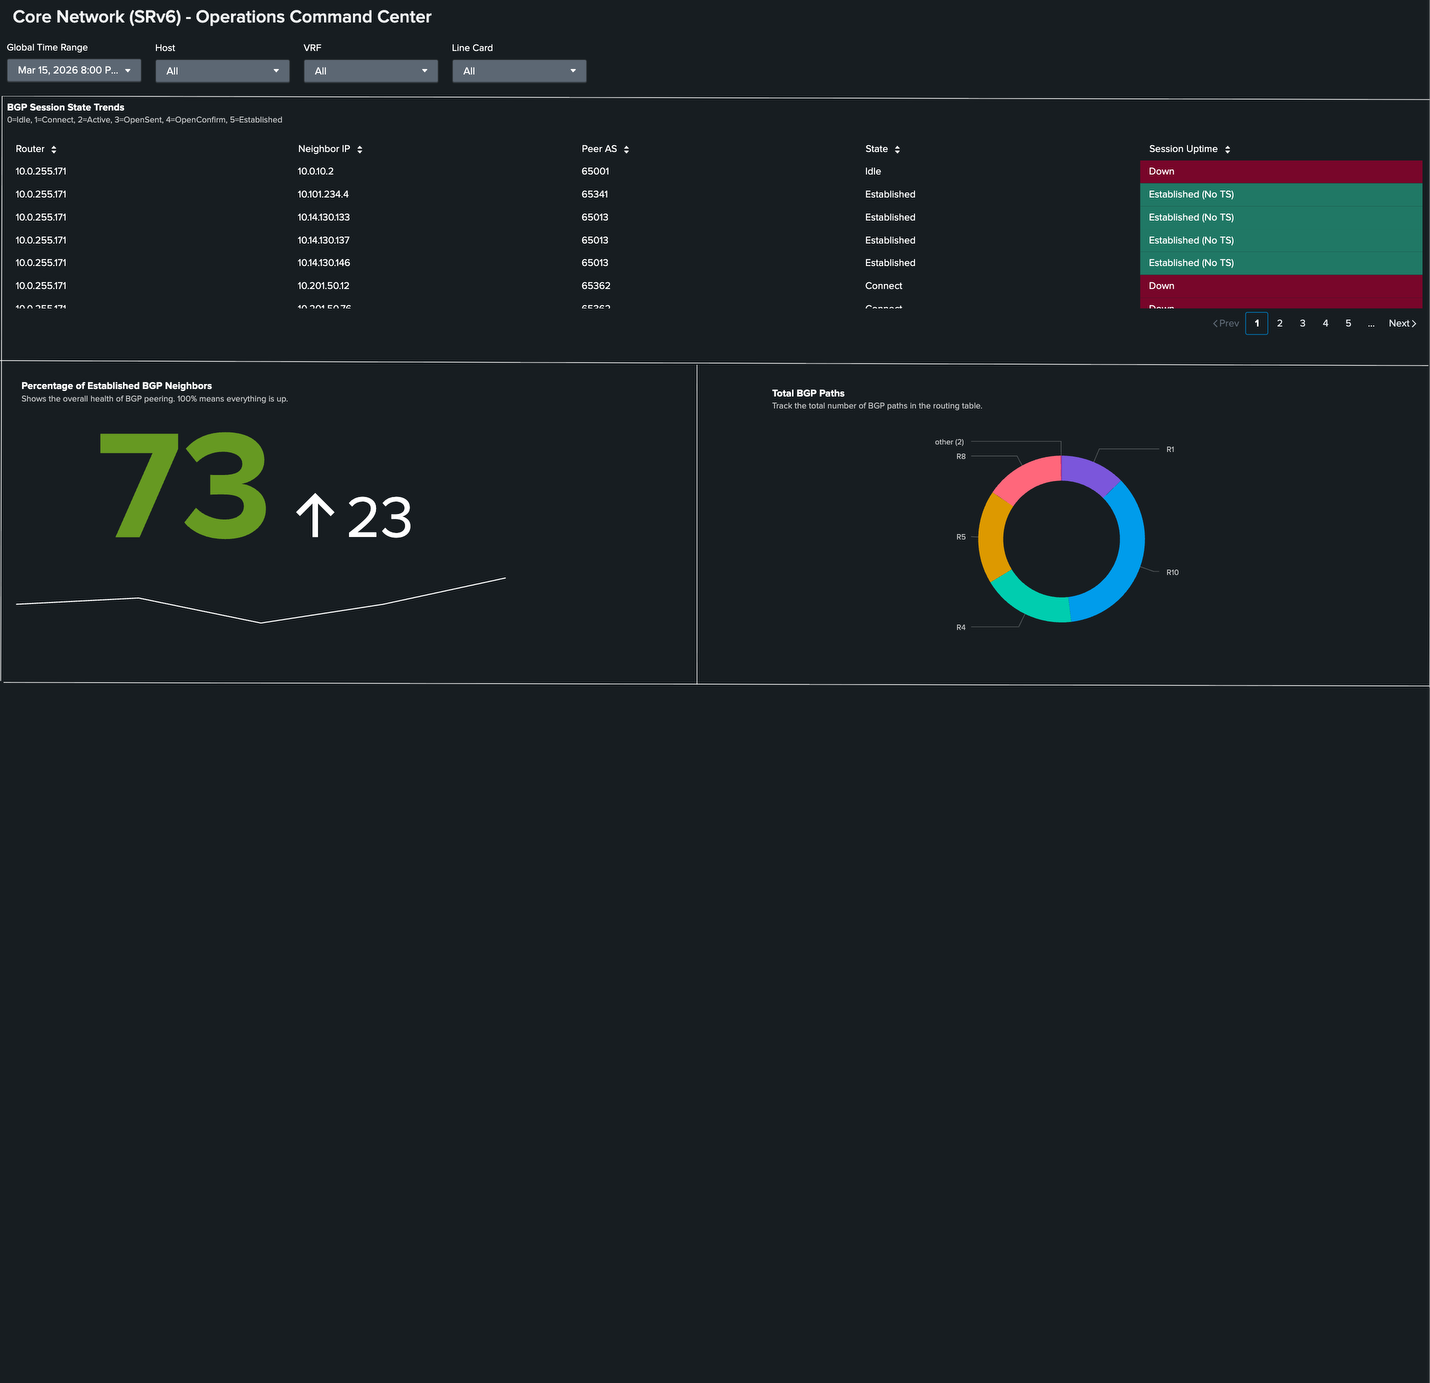
Here, in the Percentage of Established BGP Neighbors panel, we see the value at 73%. This means that several neighbors are in an idle state, also shown in the BGP Session State Trends panel, which is determined from GNMI_BGP.session_state.
Finally, this table shows the per-VRF prefix counts from Cisco-IOS-XR-fib-common-oper. ACI-MGMT is at 5 routes, and ACI_COMMON is at 172. These baseline values drop when upstream application centric infrastructure (ACI) bridge domain events occur.

The SPL behind the investigation
The information you will want to display in your Operations Network Command Center for SRv6 will vary by devices and topology. Here are some sample searches that you might want to include.
Purpose: Zombie SID detection. Cross-correlate SID software state with hardware FIB.
| mstats latest(_value) as val WHERE index="cisco_metrics" AND metric_name="Cisco-IOS-XR-segment-routing-srv6-oper:srv6/active/locator-all-sids/locator-all-sid.sid_functionvalue" BY source, locator_name, sid, state
 | search source=$device$
 | eval is_zombie = if(state!="in-use", 1, 0)
 | stats sum(is_zombie) as zombie_count, count AS total_sids BY source
 | eval Status = if(zombie_count > 0, "CRITICAL: ZOMBIE SIDs DETECTED", "OK: All Clear")
 | rename source AS Router, total_sids AS "Total SIDs", zombie_count AS "Zombie SIDs"
 | table Router, "Total SIDs", "Zombie SIDs", Status
Purpose: Locator age reset detection. Near-zero age signals silent process restart.
| mstats latest("Cisco-IOS-XR-segment-routing-srv6-oper:srv6/active/locators/locator/info.create_timestamp/age_in_nano_seconds") AS age_ns WHERE index=cisco_metrics AND source="$device$" BY source, name, span=5m
 | eval age_hours = round(age_ns / 3600000000000, 3)
 | timechart span=5m avg(age_hours) AS "Locator Age (hrs)" BY name
Purpose: BGP SRv6 service count. Track L3VPN and EVPN service scale per router.
 index=cisco_mdt sourcetype="cisco:mdt:bgp"
 | mstats latest("Cisco-IOS-XR-ipv4-bgp-oper:bgp/instances/instance/instance-active/default-vrf/process-info.global/prefix_sid_srv6_layer3_svc_count") AS l3_count latest("Cisco-IOS-XR-ipv4-bgp-oper:bgp/instances/instance/instance-active/default-vrf/process-info.global/prefix_sid_srv6_layer2_svc_count") AS l2_count WHERE index=cisco_metrics AND source="$device$" BY source, span=5m
 | timechart span=5m sum(l3_count) AS "L3 SRv6 Services" sum(l2_count) AS "L2 EVPN Services" by source
Purpose: FIB route count per VRF. Detect upstream prefix withdrawals affecting customer VRFs.
| mstats
     latest("fib_summary.routes") as Prefixes
     latest_time("fib_summary.routes") AS last_seen
     WHERE index=cisco_metrics AND source="$device$" vrf_name="$vrf_name$" node_name="$node_name$"
     BY source, node_name, protocol_name, vrf_name
 | eval "Last Updated" = strftime(last_seen, "%Y-%m-%d %H:%M:%S")
 | eval vrf_name=replace(vrf_name, "\\*+", "iid")

 | rename source AS "Device IP", node_name AS "Node", protocol_name AS "Protocol", vrf_name AS "VRF"
 | table "Device IP", "Node", "VRF", "Protocol", Prefixes, "Last Updated"
 | sort "VRF", "Protocol"
Summary: What SRv6 migration operations actually require
Traditional monitoring tools monitor device state. They check if interfaces are up, if BGP sessions are established, and if SNMP traps have fired. This is sufficient for stable, mature technology. However, SRv6 interworking is neither stable nor mature in most deployments. It is an active transition with novel failure modes that don't map to traditional alarm conditions.
The Splunk platform fills this gap by treating it as a data problem. The YANG paths for zombie SID detection, locator age monitoring, and SID hardware utilization exist in Cisco IOS-XR. The Cisco MDT collects them. SPL correlates them. The Network Monitor SRv6 dashboard surfaces them with operational context. None of this requires a proprietary SRv6 monitoring module. It requires a platform flexible enough to collect any telemetry, correlate any data sources, and surface any operational signal that matters.
For network teams managing this transition today, that flexibility is exactly what the operational model demands. SRv6 is still evolving. New capabilities, new hardware platforms, and new failure modes will emerge. A platform that lets operations teams adapt their own telemetry collection and detection logic as the technology matures is the right foundation for managing a network that is still evolving.
Next steps
Ready to learn more about providing network assurance in your organization? Check out the other articles in this series: