Troubleshooting cross-domain network problems in minutes
A critical web service goes down. Six teams join the bridge call. Networking checks the border gateway protocol (BGP). The data center team checks the application centric infrastructure (ACI). Security checks the firewall. The VMware team checks the ESX host. Everyone comes back with the same answer: not us. Forty-five minutes later, the root cause turns out to be a single bridge domain withdrawal in ACI—a fact that was visible in the telemetry the entire time.
This is not a rare scenario. It plays out in enterprise networks every week. The signal exists. The problem is that it's scattered across platforms that don't share a data model, a timeline, or a service context. Pulling it together manually, under incident pressure, is where MTTR inflates from minutes to hours.
This article shows how the Splunk platform ingests telemetry from every layer of the enterprise service stack and gives operations teams the correlated, service-level view needed to move from symptom to root cause fast, using real data, real source types, and real SPL.
Prerequisites
Software
This capability is built on a specific set of Splunk apps and Cisco technical add-ons working together:
- Enterprise Network Command Center. This is a private app built on Splunk Enterprise. It provides an end-to-end service health view, and was custom built to show the full-stack health score and per-domain KPI breakdown in one dashboard. While this app is not publicly available, this article demonstrates the power of what you can build on the Splunk platform to achieve this use case. The exact SPL for some of the searches is given to get you started. Additional help in building a similar app tailored to your environment is available through the developer documentation or an engagement with Professional Services.
- Cisco DC Networking App (formerly ACI Add-on). A direct API integration with the Cisco Application Policy Infrastructure Controller (APIC). Monitors leaf-and-spine health, fabric anomalies, tenant health, and bridge domain state.
- Cisco ThousandEyes App. Pulls cloud and enterprise agent test results for end-to-end path visibility, including availability, loss, latency, and jitter.
- ITSI Content Pack for Cisco Data Centers. Pre-configured service trees and KPIs for ACI and Nexus environments. Accelerates ITSI deployment for DC teams.
- Add-ons for VMware and VMware Metrics. Correlate virtual machine and ESX performance with the underlying ACI fabric using the VI API.
- Cisco Secure Firewall. Ingests Firepower Threat Defense (FTD) events via eStreamer, including DNS response types, network address translations (NAT), and rule actions.
- Splunk ITSI (ITSI). Correlation engine that aggregates raw telemetry into service-level health scores, runs adaptive thresholding with ML, and compresses thousands of raw alerts into structured episodes.
Telemetry onboarding: What gets ingested and how
| Data source | Integration / TA | Splunk sourcetype |
|---|---|---|
| Cisco ACI | Cisco DC Networking TA (APIC REST API + Nexus syslog) | cisco:dc:aci:health cisco:dc:aci:* |
| ThousandEyes | Cisco ThousandEyes App (REST API, scheduled pull) | thousandeyes:* |
| Cisco IOS-XR | Cisco MDT TA via gRPC/gNMI (Telegraf pipeline) | openconfig:* / GNMI_BGP.* |
| Cisco Firepower | Cisco Secure Firewall TA (eStreamer) | cisco:sfw:estreamer |
| VMware ESX | Add-on for VMware (VI API, scheduled) | vmware:perf:cpu vmware:perf:net vmware:events |
Critical KPIs and what they reveal
To learn how to set up and manage KPIs in Splunk ITSI, see Overview of creating KPIs in ITSI.
| KPI | What it tells you |
|---|---|
| ITSI Service Health Score | Composite 0–100 weighted score across all networking domains. A collapse immediately signals business impact. |
| ThousandEyes HTTP Availability | Test_Metrics.metric_name: http.server.request.availability — synthetic user-perspective reachability. |
| ThousandEyes Packet Loss % | Test_Metrics.metric_name: network.loss — 100% confirms hard connectivity failure, not degradation. |
| ThousandEyes Response Time | Test_Metrics.metric_name: http.client.request.duration — end-to-end application response latency. |
| BGP Session State | GNMI_BGP.session_state — neighbor state per peer. Idle/Active means the session is down. |
| BGP Prefixes Accepted (per VRF) | Cisco-IOS-XR-ipv4-bgp-oper: .../neighbor.af_data/prefixes_accepted — prefix withdrawal detection. |
| ACI Fabric / Tenant Health | cisco:dc:aci:health — fabric, tenant, bridge domain, and EPG health scores from APIC. |
| ACI Fault Events | cisco:dc:aci:* — fault codes, severity, and root cause analysis events from the fabric. |
| ESX CPU / Memory / Network | vmware:perf:cpu, vmware:perf:mem, vmware:perf:net — confirms or rules out VM resource contention. |
| Firepower Rule Actions | cisco:sfw:estreamer — allow/deny decisions and NAT events. Confirms policy is not blocking traffic. |
The following diagram shows the full enterprise service chain: Web VM → ACI datacenter → Nexus → core IOS-XR routers → MPLS/Internet. This is the topology that the Splunk platform monitors end-to-end from the Network Monitor – Acme dashboard.

Operational scenario: ACI bridge domain withdrawal
The following steps show different dashboards in the custom-built network monitor app and how the data included in each helps the team to troubleshoot the Acme network problem described in the opening scenario. These dashboards are built on the KPIs described above, and the SPL is provided for select dashboard panels in the SPL section below.
Step 1: Two facts established in under sixty seconds
The Service Health Scorecard dashboard shows a number of key metrics at a glance:
- ThousandEyes and Upstream Connectivity KPIs are both critical and the composite score is zero.
- A BGP alert fires simultaneously: the expected four prefixes from the ACI neighbor at 10.30.4.137 have dropped to zero.
- The web server's subnet has been withdrawn.

Two facts are now established without opening a single CLI session: the outage is real and it originates from the ACI-to-BGP handoff.
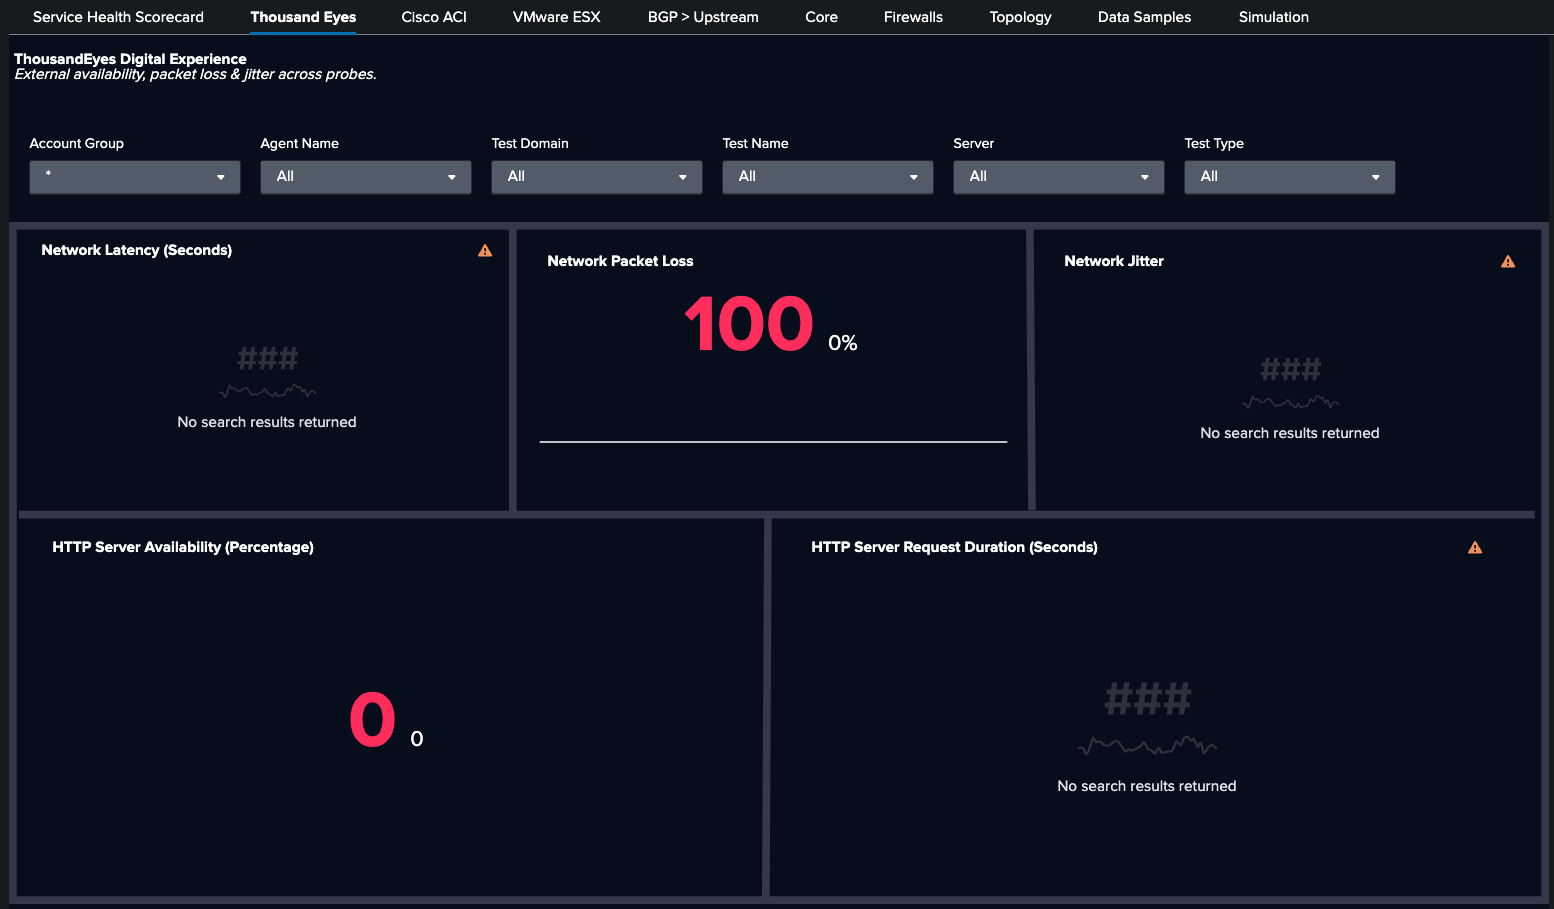
Moving to the ThousandEyes dashboard, you see HTTP availability at 0% and packet loss at 100%. Using Test_Metrics.metric_name: http.server.request.availability and network.loss, you are able to confirm a full user-facing outage.
Next, the BGP > Upstream dashboard shows BGP neighbor 10.30.4.137 (ACI): prefixes_accepted dropped from 4 to 3. The Cisco-IOS-XR-ipv4-bgp-oper YANG path confirms prefix withdrawal from ACI.

Step 2: ACI is the culprit
The Cisco ACI dashboard shows that fabric health is normal. There are no leaf-and-spine hardware faults and no EPG issues. Drilling into the tenant MAPLE reveals the root cause: bridge domain MAPLE_BD04_SPLUNK is offline. That domain owns the subnet 10.30.4.0/24, which is now withdrawn. The ACI fault event is visible in cisco:dc:aci:* with severity and root cause analysis context.

Step 3: Four other layers ruled out with data
The Core dashboard shows that all interface states are operational. eth_inerr and eth_indiscard counter at zero; the router layer is clean. cisco:sfw:estreamer shows no unusual deny actions or NAT failures. The security policy is not a factor.

Finally, the VMware ESX dashboard shows that vmware:perf:cpu and vmware:perf:net are within normal bounds. No VM resource contention contributes to the outage.

The SPL behind the investigation
Dashboard: BGP > Upstream
Panel: Prefix Loss
Purpose: BGP prefix withdrawal detection using the exact YANG path from the Cisco model-driven telemetry pipeline
 | mstats max("Cisco-IOS-XR-ipv4-bgp-oper:bgp/instances/instance/instance-active/vrfs/vrf/afs/af/neighbor-af-table/neighbor.af_data/prefixes_accepted") AS prefixes_accepted WHERE index="cisco_metrics" AND af_name="ipv4-unicast" span=1m BY neighbor_address, source
| search source=* neighbor_address=*
 | fields _time, source, neighbor_address, prefixes_accepted
 | search prefixes_accepted<4.000000
Dashboard: Cisco ACI
Panel: Bridge Domain Inactive
Purpose: ACI fault detection — surface bridge domain offline events with RCA context
| inputlookup bdlist.csv
 | fields "Bridge Domain Name"
 | eval key=trim('Bridge Domain Name')

 | join type=left key [
     search eventtype=cisco_dc_aci_health component=fvBD dn="uni/*" apic_host=apic-inb.maple.ciscolabs.com
     | rex field=dn "tn-(?<TenantName>[^/]+)"
     | search TenantName=Maple
     | eval key=trim(name)
     | stats latest(cur) AS cur BY key
 ]

 | where isnull(cur)
 | rename key AS "Bridge Domain Name"
 | table "Bridge Domain Name"
Dashboard: ThousandEyes
Panel: Network Packet Loss
Purpose: ThousandEyes availability and packet loss correlated on a single timeline
| tstats `summariesonly` avg(Test_Metrics.metric_name:network.loss) as avg_loss  FROM datamodel="Cisco_ThousandEyes.Test_Metrics" WHERE * * * * * (* OR NOT Test_Metrics.server.address="*") Test_Metrics.metric_name:network.loss="*" Test_Metrics.thousandeyes.test.type IN ("agent-to-server", "agent-to-agent") BY _time | timechart avg(avg_loss) AS avg_loss
| append [| tstats `summariesonly` avg(Test_Metrics.metric_name:network.loss) AS avg_loss  FROM datamodel="Cisco_ThousandEyes.Test_Metrics" WHERE * * * * * (* OR NOT Test_Metrics.server.address="*") Test_Metrics.metric_name:network.loss="*" Test_Metrics.thousandeyes.test.type IN ("agent-to-server", "agent-to-agent") ]
Dashboard: VMwareESX
Panel:
Purpose: VMware network drop check to confirm that ESX is not contributing to the outage
index=vmware-perf sourcetype=vmware:perf:net instance=aggregated
 | stats sum(p_summation_net_droppedRx_number) AS dropped_rx,
         sum(p_summation_net_droppedTx_number) AS dropped_tx,
         sum(p_summation_net_errorsRx_number) AS errors_rx,
         sum(p_summation_net_errorsTx_number) AS errors_tx
         BY moid
 | where dropped_rx > 0 OR dropped_tx > 0 OR errors_rx > 0 OR errors_tx > 0
 | sort -dropped_rx
Why cross-domain correlation changes MTTR
Each of these queries runs against a single Splunk index with a shared timeline. When ThousandEyes availability hits zero at the same minute that BGP prefixes_accepted drops to zero, the correlation requires only a query, not a forty-five minute war room.
This gets even better with Splunk ITSI (ITSI), which can compress the resulting 6,000+ raw alerts into one structured episode. One engineer resolves in minutes what previously required six teams.
This ITSI service analyzer shows the ACME service degraded, the ACI bridge domain KPI marked critical, and the ThousandEyes and Upstream KPIs degraded. The composite score is broken down by contributing domain.

This dashboard shows 6,000+ raw alerts compressed into one episode. The severity timeline, contributing KPIs, and root cause context are all in a single structured incident.

Summary: The operational shift
The traditional model puts a different tool in front of each team. Each tool is right about its own domain and blind to everything else. When an outage crosses domain boundaries—as most do—the investigation becomes a coordination problem as much as a technical one.
Splunk ITSI sits above the domain tools as a common data layer. The Cisco DC Networking TA, ThousandEyes Add-on, eStreamer, and VMware Add-on all feed into a shared index with a shared timeline. The relationship between an ACI bridge domain withdrawal and a ThousandEyes availability failure isn't something anyone figures out manually; it's on the dashboard because both events share a common service context in ITSI.
In networks where minutes of downtime translate directly into revenue impact, SLA credits, and customer trust, Splunk ITSI is the operational layer that makes cross-domain assurance a reality, not a future roadmap item.
Next steps
Ready to learn more about providing network assurance in your organization? Check out the other articles in this series: