Assuring enterprise WAN Services with Splunk software
Cisco SD-WAN brought application-aware routing and centralized policy to enterprise WAN architecture. But it also changed the failure surface. In a traditional multiprotocol label switching (MPLS)-only design, a site going dark usually means a link is physically down. In SD-WAN, the same symptom can originate from a bidirectional forwarding detection (BFD) session timeout, an Overlay Management Protocol (OMP) route withdrawal, a transport-level SLA crossing, or an underlying WAN interface failure. Each requires a different investigation path and different remediation.
The vManage controller (recently rebranded as Cisco SD-WAN Manager) provides visibility into device state and policy application. What it doesn't provide is a service-level view: which sites are affected, how severely, and what is causing the degradation across the WAN hierarchy from site to device to interface. That cross-layer context is what Splunk software delivers.
Prerequisites
Software
This capability is built on a specific set of Splunk apps and Cisco technical add-ons working together:
- Acme SD-WAN Operations Command. This is a private app built on Splunk Enterprise. This is a custom set of dashboards for a fictional ACME network that provides insight into tunnel stability, application path steering, and WAN interface health. While this app is not publicly available, this article demonstrates the power of what you can build on the Splunk platform to achieve this use case. The exact SPL for some of the searches is given to get you started. Additional help in building a similar app tailored to your environment is available through the developer documentation or an engagement with Professional Services.
- Cisco Catalyst Add-on. Ingests vManage controller data, device telemetry, tunnel SLA metrics, unified threat defense (UTD) security events, and system logs through the vManage REST API.
- Splunk Stream (NetFlow from vEdge/cEdge). Provide fine-grained flow analysis for application mix, east-west versus internet traffic, and rare application (shadow IT) detection.
- Splunk ITSI (ITSI). Maps SD-WAN telemetry into service trees with site-level health scores. Adaptive thresholding detects degradation before hard thresholds fire.
Telemetry onboarding: Controller + device + flow
| Data source | Integration / TA | Splunk sourcetype |
|---|---|---|
| Site and device health | Cisco SD-WAN TA (vManage REST API) | cisco:sdwan:sitehealth |
| Tunnel SLA metrics | Cisco SD-WAN TA (vManage REST API) | cisco:sdwan:tunnelhealth |
| WAN links and interfaces | Cisco SD-WAN TA (vManage REST API) | cisco:sdwan:linkhealth |
| Security service edge (SSE) tunnel state | Cisco SD-WAN TA (vManage REST API) | cisco:sdwan:ssetunnels |
| UTD threat and policy | Cisco SD-WAN TA (vManage REST API) | cisco:sdwan:utd:logs |
| System and control events | Cisco SD-WAN TA (vManage REST API) | cisco:sdwan:system:logs |
| Application flow data | Splunk Stream (NetFlow from edges) | stream:netflow |
Critical KPIs for SD-WAN operations
To learn how to set up and manage KPIs in Splunk ITSI, see Overview of creating KPIs in ITSI.
| KPI | What it tells you |
|---|---|
| Site Health Score (Per Site) | Derived from cisco:sdwan:sitehealth — tunnel, device, and application health aggregated per location. |
| Tunnel State (Up/Down) | cisco:sdwan:tunnelhealth — per-tunnel operational state. Down tunnels indicate failed connectivity between sites. |
| Tunnel Packet Loss % | cisco:sdwan:tunnelhealth — packet loss per tunnel. Above threshold triggers SLA-based path switching. |
| Tunnel Latency (ms) | cisco:sdwan:tunnelhealth — round trip time (RTT) per tunnel. Drives path selection for latency-sensitive apps like Zoom, VoIP. |
| Tunnel Jitter (ms) | cisco:sdwan:tunnelhealth — packet delay variation. Critical for real-time application quality. |
| WAN Interface Operational State | cisco:sdwan:linkhealth — per-interface up/down state, speed, and incoming/outgoing (RX/TX) kbps utilization. |
| BFD Session State | cisco:sdwan:sitehealth — BFD down equals tunnel failure imminent or in progress. |
| OMP Peer State | cisco:sdwan:system:logs — OMP session health. Loss disrupts route distribution from vSmart. |
| UTD Threat Events | cisco:sdwan:utd:logs — blocked/allowed actions, threat categories, reputation scores, signature IDs. |
| Rare Application Detection | stream:netflow — Shadow IT identification via rare application flow analysis across edges. |
Operational scenario: Toronto hub degradation
Service view: Scope in seconds
The following ITSI Glass Table of the full SD-WAN fabric uses cisco:sdwan:sitehealth data to reveal that Toronto health is degraded. All other sites—Ottawa, Edmonton, Calgary, and the Secure Access nodes—are green. The scope of the problem is confirmed before any drill downs. For a ten-site fabric, confirming scope manually through vManage means opening each site's device list and checking tunnel states individually. With Splunk software, it's one view, one second.

Next, drill down into the service analyzer to examine the SD-WAN service. It shows that device health and tunnel health are degraded. Application health is also yellow. Based on this information, the focus of the investigation should be edge devices and WAN interfaces. This means that policy configurations and vManage state can be ruled out as causes.

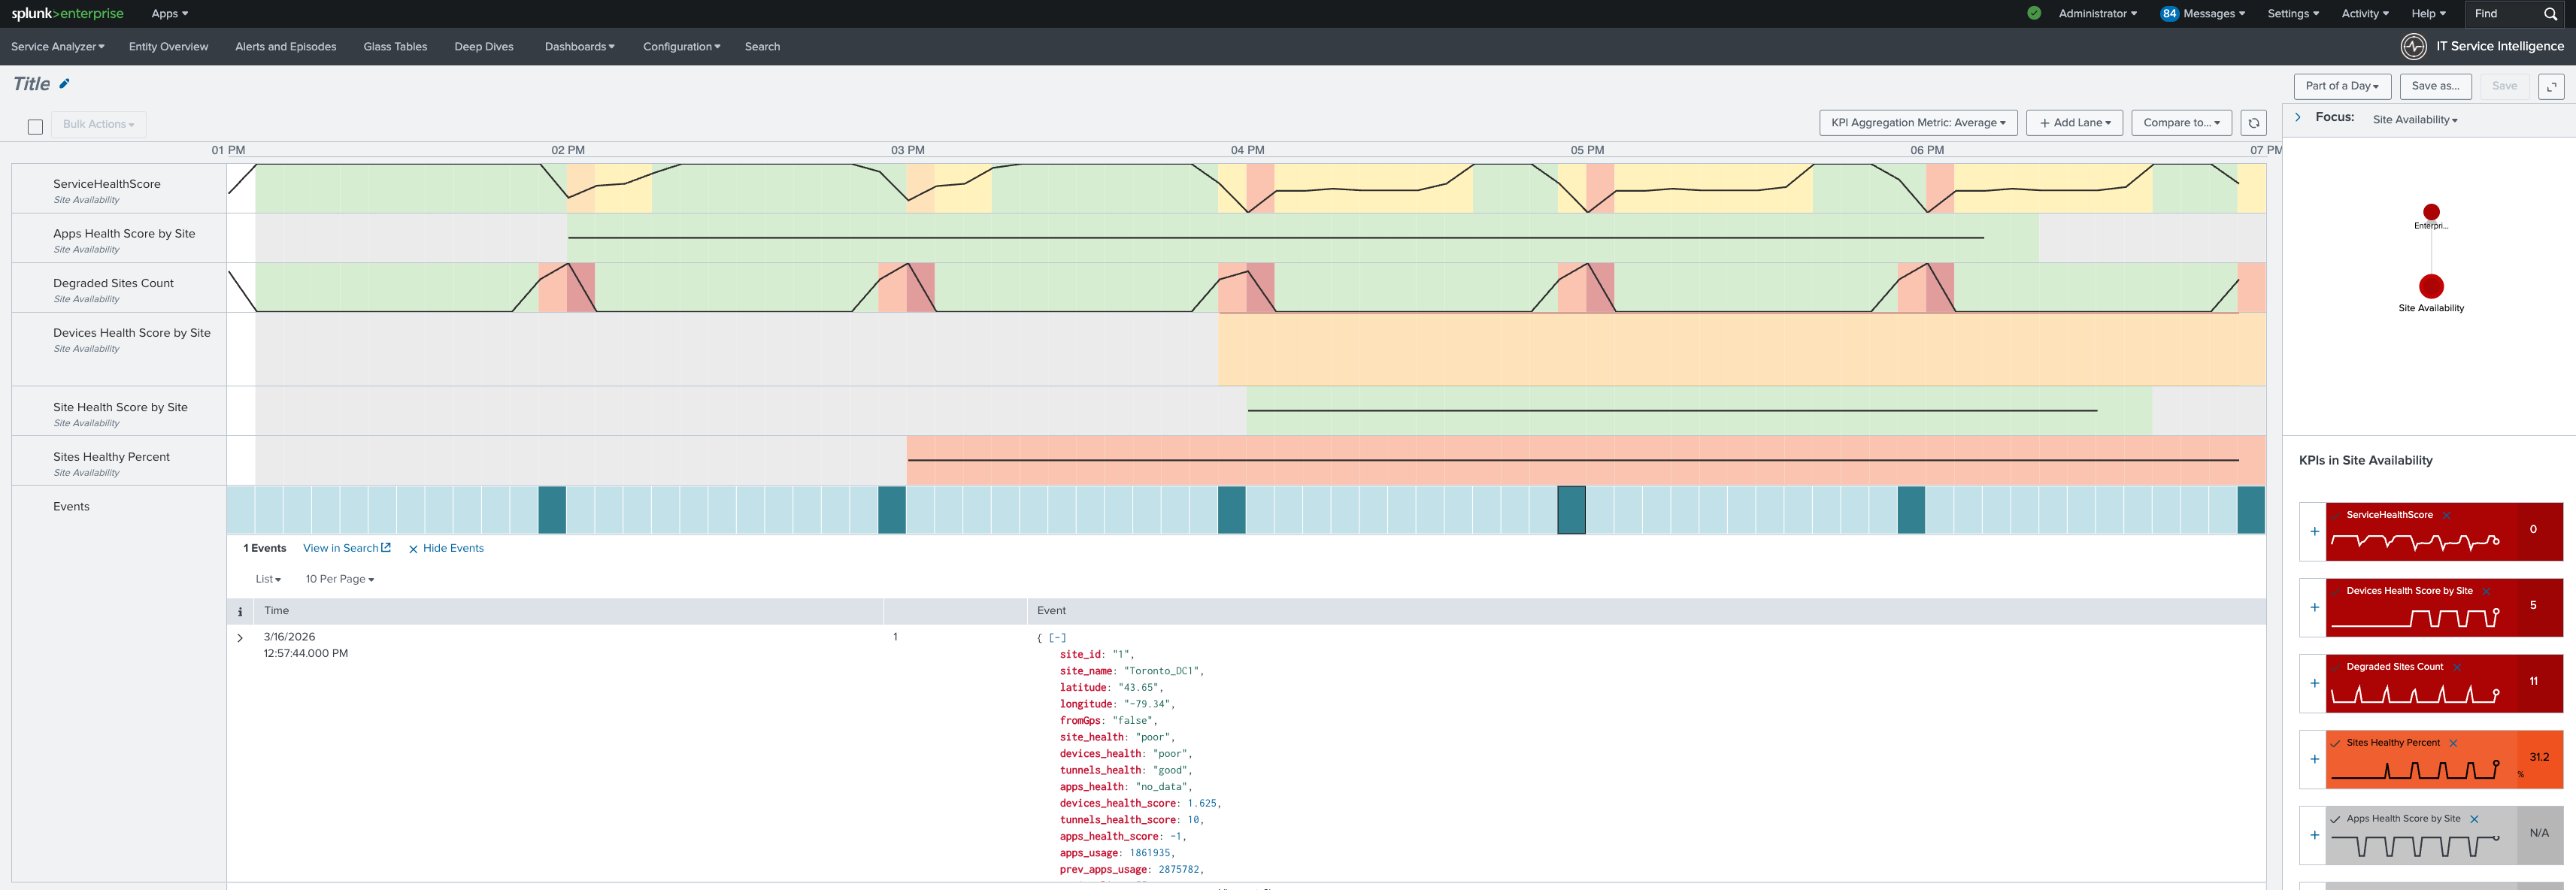
Finally, review this KPI timeline using the cisco:sdwan:sitehealth and cisco:sdwan:tunnelhealth data sources. You can see that device health degraded first, followed by tunnel health. The onset timestamp is visible in the timeline for change correlation.
Operations command center: Infrastructure detail
The operations command center main dashboard in the Splunk platform shows key information at a glance, such as site health percentage, tunnels down count, and device availability. Toronto degradation is reflected in all aggregate metrics from cisco:sdwan:sitehealth.

Links and interfaces: Root cause confirmed
The Links and Interfaces tab surfaces the physical state of WAN interfaces per edge device using cisco:sdwan:linkhealth.
- Multiple interfaces on the Toronto cEdge are operationally down.
- BFD sessions on those paths have timed out.
- OMP has withdrawn the routes those tunnels were carrying.
The cascade from interface failure to tunnel drop to site degradation is complete and traced end-to-end without a single CLI session.

The SPL behind the investigation
The information you will want to display in your Operations Command Center will vary by devices and topology. Here are some sample searches that you might want to include.
Purpose: WAN interface failures correlated with downstream tunnel drops
index=sdwan sourcetype="cisco:sdwan:linkhealth"
 | lookup sdwan_entities_master device_ip as vdevice-name
 | fields vdevice-name if-oper-status if-admin-status ip-address speed-mbps vpn-id ifname details entity_type site
 | stats
     latest(if-admin-status) AS admin
     latest(if-oper-status) AS oper
     latest(ip-address) AS ip
     latest(speed-mbps) AS speed
     latest(vpn-id) AS vpn latest(details) AS device_detail latest(entity_type) AS device_role latest(site) AS site
     BY vdevice-name ifname
 | eval status_icon=case(
     (admin="if-state-up" OR admin="Up") AND (oper="if-oper-state-ready" OR oper="Up"), "UP",
     (admin="if-state-up" OR admin="Up") AND (oper="if-oper-state-down" OR oper="Down"), "DOWN",
     admin="if-state-down" OR admin="down", "ADMIN_DOWN",
     1=1, "UNKNOWN")
 | where status_icon!="P"
 | sort vdevice-name vpn ifname
 | head 50
 | table vdevice-name ifname status_icon admin oper ip speed vpn device_detail device_role site
Purpose: Tunnel health summary—identify sites with tunnel availability below threshold
index=sdwan sourcetype="cisco:sdwan:tunnelhealth"
 | fields _time name loss_percentage latency jitter state health local_color remote_color site_id
 | stats latest(*) AS * BY name
 | lookup site_name site_id AS site_id OUTPUT site_name
 | eval
     loss = round(coalesce(loss_percentage, 0), 2),
     lat = round(coalesce(latency, 0), 2),
     jit = round(coalesce(jitter, 0), 2),
     path = local_color . " ↔ " . remote_color,
     status_rank = case(
         state != "Up", 1,
         loss > 5 OR lat > 250, 2,
         loss > 1 OR lat > 150 OR jit > 30, 3,
         1=1, 4),
     "SLA Status" = case(
         status_rank == 1, "DOWN",
         status_rank == 2, "SLA VIOLATION",
         status_rank == 3, "SLA DEGRADED",
         status_rank == 4, "OPERATIONAL")
 | sort status_rank - loss
 | table "SLA Status" site_name name path loss lat jit health
Purpose: UTD threat activity—surface blocked events with reputation context
index=sdwan sourcetype="cisco:sdwan:utd:logs"
 | stats count BY src_ip dest_ip Category Reputation
 | sort -count
 | head 20
Purpose: Shadow IT detection—rare application flows from stream:netflow
index=netflow sourcetype="stream:netflow" src_ip=*

 | eval application = coalesce(app, app_tag, "Unknown_Flow")
 | eval application = trim(replace(application, "\x00", ""))
 | stats
     count AS pair_flow_count
     BY application protoid src_ip dest_ip
 | eventstats
     avg(pair_flow_count) AS avg_flows
     stdev(pair_flow_count) AS dev_flows
     BY application
 | where pair_flow_count < (avg_flows - dev_flows) OR pair_flow_count <= 2
 | sort + pair_flow_count
 | table application protoid src_ip dest_ip pair_flow_count avg_flows
Inverting the investigation: From service to root cause
vManage troubleshooting starts at the device. You find a device with alerts and work upward to understand service impact. Splunk software inverts this: you start at the service (Toronto is degraded, here is the health score), drill to the contributing components (device health and tunnel health), and confirm the root cause at the device layer. By the time you reach the Links and Interfaces tab, you are not exploring—you are confirming. That inversion is where MTTR improvement comes from.
Summary: NetFlow: The Application Intelligence Layer
Beyond device and tunnel metrics, cisco:sdwan:system:logs and stream:netflow give SD-WAN operations a view that controller dashboards don't provide: actual application traffic patterns flowing across the WAN. Which applications are using the most bandwidth? Is Microsoft O365 traffic following the direct internet breakout policy or falling back through the data center? Is there an unexpected application appearing on a branch edge, such as a shadow IT tool consuming WAN capacity?
Splunk software makes these questions answerable with SPL against stream:netflow data. Combined with the UTD threat events from cisco:sdwan:utd:logs, this gives both network and security teams a unified view of what's traversing the WAN and whether it's compliant with policy.
For SD-WAN operations teams managing large enterprise fabrics, this is the operational layer that turns a reactive, alert-driven model into a proactive, service-driven one with the security context to close the gap between NetOps and SecOps in the same platform.
Next steps
Ready to learn more about providing network assurance in your organization? Check out the other articles in this series: