Preventing concurrency issues and skipped searches
A correlation search scans multiple data sources for defined patterns. When the search finds a pattern, it performs an adaptive response action. This is a powerful capability, but multiple correlation searches all running at the same time can lead to resource contention, which might result in search concurrency issues and skipped searches.
How to use Splunk software for this use case
Correlation searches in Splunk Enterprise Security (ES) should be configured with a schedule window set to auto. This allows ES dynamically shuffle the run order and evenly dispatch searches over time to avoid search latency, skipped searches, and search starvation.
This feature only works when there is a search history, which keeps track of when searches last ran and their next run time. When a standalone ES search head is restarted, it does not have a history, meaning all searches will attempt to run on their default schedule, which can lead to the concurrency issues previously mentioned.
It is strongly recommended to periodically review the Scheduler activity page within the Monitoring Console to identify skipped searches and latency issues. To access it:
- Go to Monitoring Console or Cloud Monitoring Console, then Search > Scheduler Activity.
- Run the following SPL to list the schedule window setting of the enabled correlation searches. Ensure you update searches to run on the schedule window of auto.
| rest splunk_server=local /servicesNS/-/-/saved/searches search="is_scheduled=1" search="action.correlationsearch.enabled=1" search="disabled=0"
| table title schedule_window schedule_priority
When attempting to run hundreds of correlation searches each hour within Splunk Enterprise Security, the default cron schedule might need to be adjusted to accommodate for restarts, which reset the auto scheduler configuration.
- Review the correlation search schedules using the Splunk App for Detection Insights and update the schedules as required using the following steps.

- To edit these searches, go to Configure > Content > Content Management.
- Click the name of a search to open the editing page.

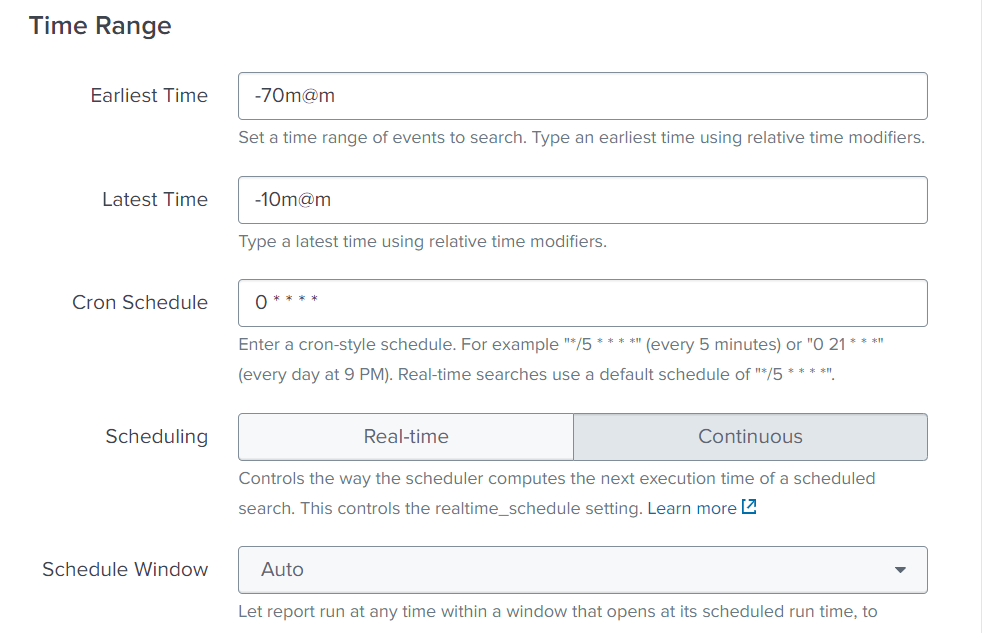
- In the Time Range section, manually adjust the Cron Schedule. For example:
- If the alerts are run hourly, then stagger which minute the alert starts on. Set your first search to 1 * * * *. Then open another search and set it to 2 * * * *. Then 3* * * * for a third search and so on.
- If the searches need to run every 5 or 10 minutes, you can splay the cron schedules to allocate searches to run on different minutes.
- For five-minute intervals, this would be 0-55/5 * * * * for the first search, 1-56/5 * * * * for the second search, then 2-57/5 * * * *, 3-58/5 * * * *, 4-59/5 * * * *, and so on.
- For ten-minute intervals, this would be 0-50/10 * * * * for the first search, 1-51/10 * * * * for the second search, then 2-52/10 * * * * and so on.
- In the Time Range section, for the search window, you should account for a delay in ingestion and data model acceleration. We recommend the following settings:
- Earliest Time:-70m@m
- Latest Time: -10m@m
Correlation search configuration reference
When in doubt, refer to this as the sample configuration for correlation searches.
- Timestamp: Event Time
- Set an appropriate window time range (-10 minute offset for tstats searches catering for potential ingestion delays & datamodel acceleration)
- Use Cron for time range (remember to skew the intervals)
- Scheduling: Continuous
- Schedule Window: Auto
- Trigger Conditions: Number of results > 0 & trigger once
- Throttling: Enabled (establish a default timerange, i.e. 4 hours)

Next steps
These additional Splunk resources might help you understand and implement this guidance:
- Splunk Help: Correlation search overview for Splunk Enterprise Security
- Splunk Help: Use cron expressions for alert scheduling
- Splunk .Conf Talk: Making the most of the Splunk Scheduler
- Splunkbase App: Splunk App for Detection Insights

