Using Federated Search for Amazon S3 for monitoring and detection
Federated Search for Amazon S3 has traditionally been employed for threat hunting, audit and compliance, and occasional ad hoc searches—all use cases characterized by infrequent queries with lookback periods extending several months. However, more frequent search patterns like monitoring and detection represent an underutilized opportunity for cost optimization.
This article examines key considerations for implementing federated search use cases and explores examples where organizations are successfully deploying it beyond sporadic ad-hoc queries.
Data Scan Units (DSUs) considerations
Federated Search operates on a consumption-based licensing model using Data Scan Units (DSUs) that "burn down" as data from the S3 buckets are scanned. The key to understanding DSU consumption is that it remains relatively consistent whether you're:
- Scanning small data volumes frequently
- Scanning moderate data volumes less frequently
- Scanning large data volumes infrequently
Optimizing Federated Search for frequent access patterns
Federated Search for S3 (FS-S3) can cost-effectively support monitoring and detection use cases—which are workloads that require more frequent data access—when compared to traditional index ingestion and search operations.
To support threat reporting, monitoring and alerting or similar use cases, ensure your data meets these criteria:
- Partitioning: Data is organized by type and contained in partitions of 1 day or less
- Format: JSON or Parquet formats
- Compression: Data is compressed in supported types
- Time range (lookback period): 1 day or less
- Query frequency: Every 15 minutes or less
- Average search per day: 100
Practical implementation
This guide demonstrates how to leverage Federated Search for Amazon S3 to build dashboard panels using scheduled searches and summaries from data written to Amazon S3 in HEC (HTTP Event Collector) format via Ingest Processor.
If you want to use Federated Search for Amazon S3 with supported AWS log sources instead of HEC data, Splunk software can create AWS Glue tables that reference the datasets at those locations. Read more about this in the documentation.
Prerequisites
Ensure you are familiar with Amazon S3, AWS Glue, Amazon Athena, the Splunk Edge Processor and Ingest Processor, and Splunk’s federated search for Amazon S3. If any of these topics are not familiar, consider taking a few minutes to review them or make sure the documentation is handy. You can also find additional information about partitioning in the article Partitioning data in S3 for the best FS-S3 experience.
Edge Processor pipelines support Search Processing Language 2 (SPL2). If the SPL2 syntax is new to you, review the SPL2 Search Reference documentation.
Data used in this example
Zscaler-nss web data is used in this example, but Federated Search for Amazon S3 can be used with other data sources in supported formats.
How to use Splunk software for this use case
Getting started
The implementation process includes:
- Creating a Glue Catalog and Table: Establishing the metadata structure for your S3 data
- Configuring Federated Search for Amazon S3: Setting up the connection between your search platform and S3 storage
- Validate Federated Search Functionality: Confirming that results are returned in the Search and Reporting app
- Scheduling & Summarizing Searches: Automating query execution for continuous monitoring
If you've already configured Federated Search for Amazon S3, proceed directly to the scheduling searches section.
Configure AWS Glue
The following Glue configurations must be in the same region as your Splunk Cloud Platform tenant.
Create an AWS Glue database
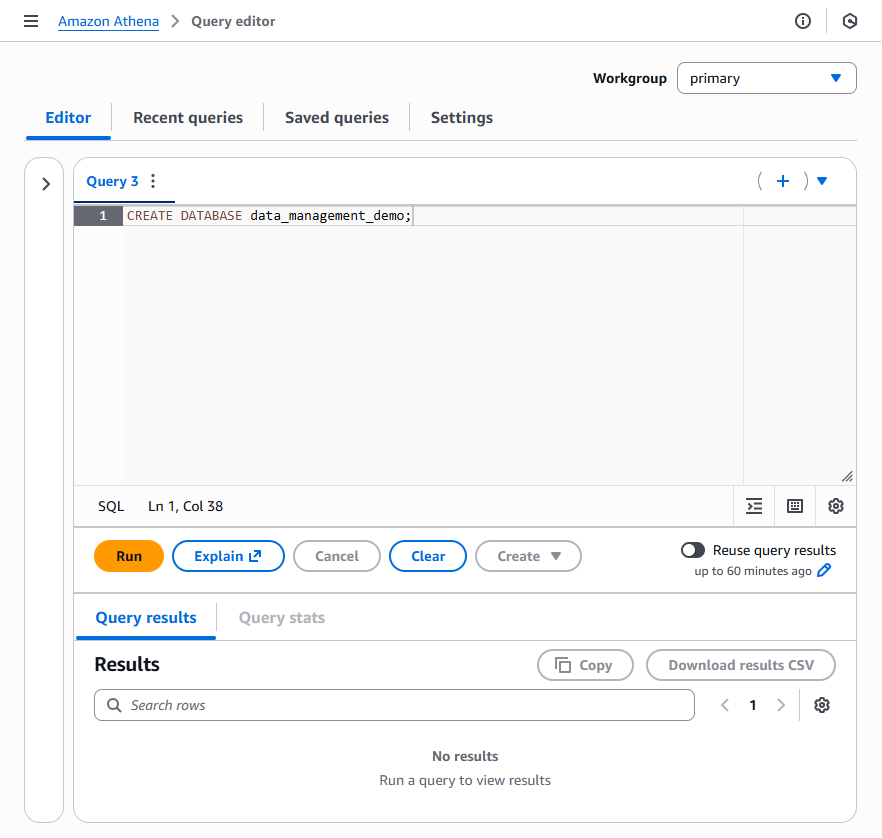
If a suitable existing Glue Database does not exist, open the Amazon Athena Query Editor and create a new database using the syntax below. Optionally, replace data_management_demo with a database name of your choice. Note that subsequent examples will use the data_management_demo name and will need to be replaced if you change it.
Create an AWS Glue table
A Glue table is a metadata definition that represents your data. You’ll create this table using an Amazon Athena query. Other methods are available to accomplish this, but the standard structure of HEC output makes the DDL method a good choice.
The Zscaler data used in this example was written to Amazon S3 by Ingest Processor (IP). IP outputs events to S3 in supported file types using the HTTP Event Collector (HEC) format. The Zscaler data used in our example is gzipped JSON.
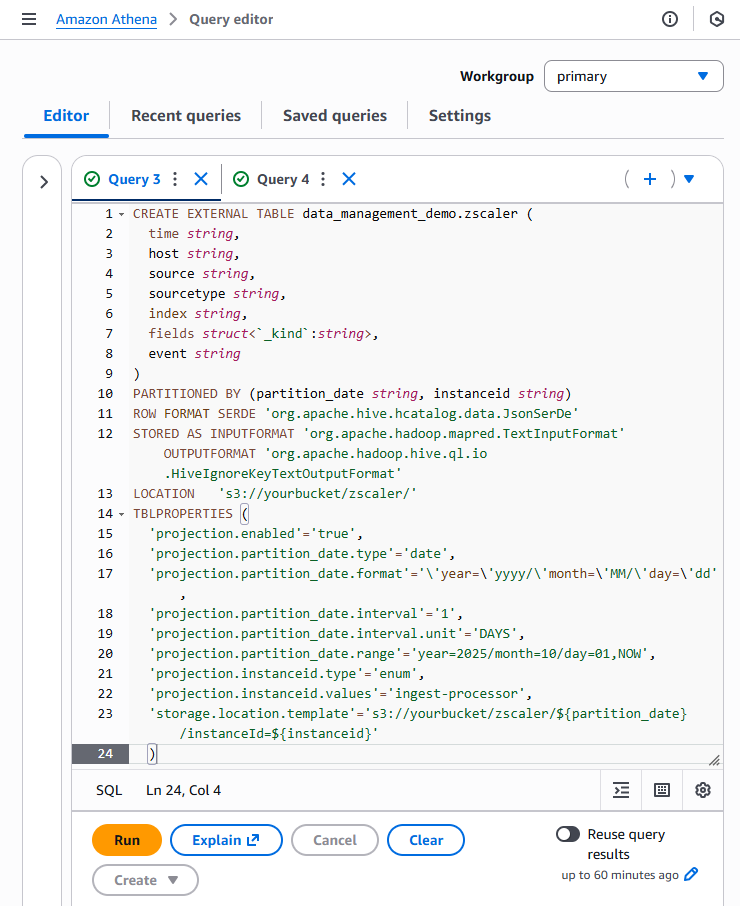
If you are following along with data output by IP in JSON format, the Athena query below should be applicable to your data with a few minor changes:
LOCATION 's3://yourbucket/folder/'will need to update this to your S3 bucket name. If you used a folder name (such as use of ‘zscaler’ in our example) when writing data with IP it will need to be updated as well.- The same update for the S3 bucket and folder is necessary for the storage location template
'storage.location.template'='s3://yourbucket/zscaler/${partition_...=${instanceid}'. - The example uses partition projection with a projection range starting at the beginning of November 2025. You might need to adjust the starting range to ensure that partitions are projected to support your dataset.
'projection.partition_date.range'= year=2025/month=11/day=01,NOW',
You might also need to update SerDe parameters if data is output in a format other than JSON.
CREATE EXTERNAL TABLE data_management_demo.zscaler (
  time string,
  host string,
  source string,
  sourcetype string,
  index string,
  fields struct<`_kind`:string>,
  event string
)
PARTITIONED BY (partition_date string, instanceid string)
ROW FORMAT SERDE 'org.apache.hive.hcatalog.data.JsonSerDe'
STORED AS INPUTFORMAT 'org.apache.hadoop.mapred.TextInputFormat' OUTPUTFORMAT 'org.apache.hadoop.hive.ql.io.HiveIgnoreKeyTextOutputFormat'
LOCATION   's3://yourbucket/zscaler/'
TBLPROPERTIES (
  'projection.enabled'='true',
  'projection.partition_date.type'='date',

  'projection.partition_date.format'='\'year=\'yyyy/\'month=\'MM/\'day=\'dd',
  'projection.partition_date.interval'='1',

  'projection.partition_date.interval.unit'='DAYS',

  'projection.partition_date.range'=''projection.partition_date.range'= year=2025/month=11/day=01,NOW',
  'projection.instanceid.type'='enum',
  'projection.instanceid.values'='ingest-processor',

  'storage.location.template'='s3://yourbucket/zscaler/${partition_...=${instanceid}'
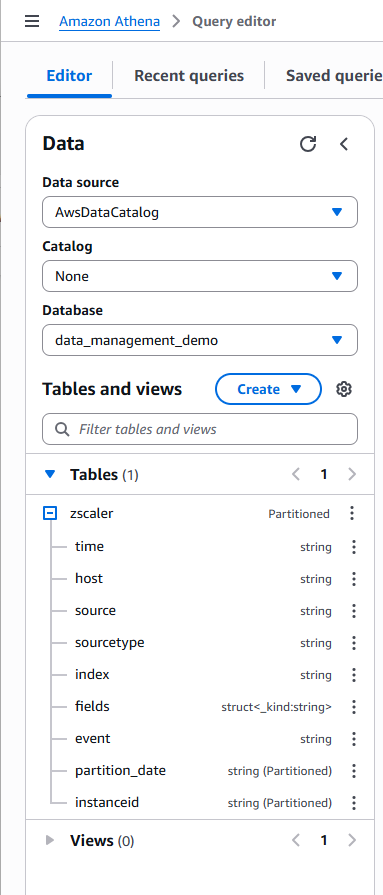
Confirm that the Glue database and table were created successfully by reviewing the Tables in the Data box in the left panel, as shown below.
Configure Federated Search for Amazon S3
The next step is to configure a federated provider and federated indexes in the Splunk platform.
- Open the Federation interface and click Settings.
- Under DISTRIBUTED ENVIRONMENT, click Federation.

- On the Federation interface, click Add federated provider in the top right of the screen.
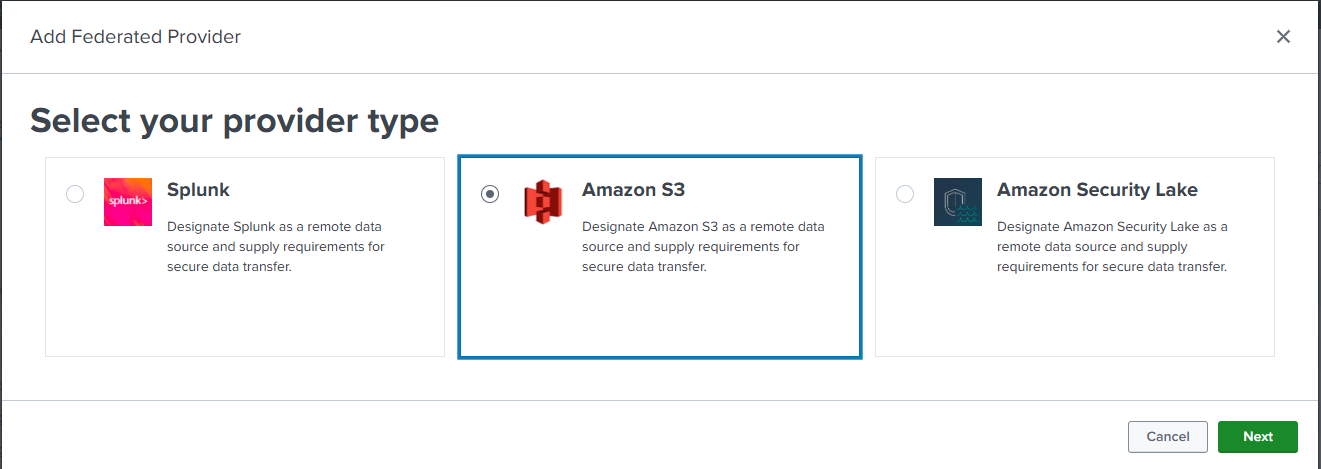
- The Splunk platform will prompt to Select your provider type. Select Amazon S3, then click Next.
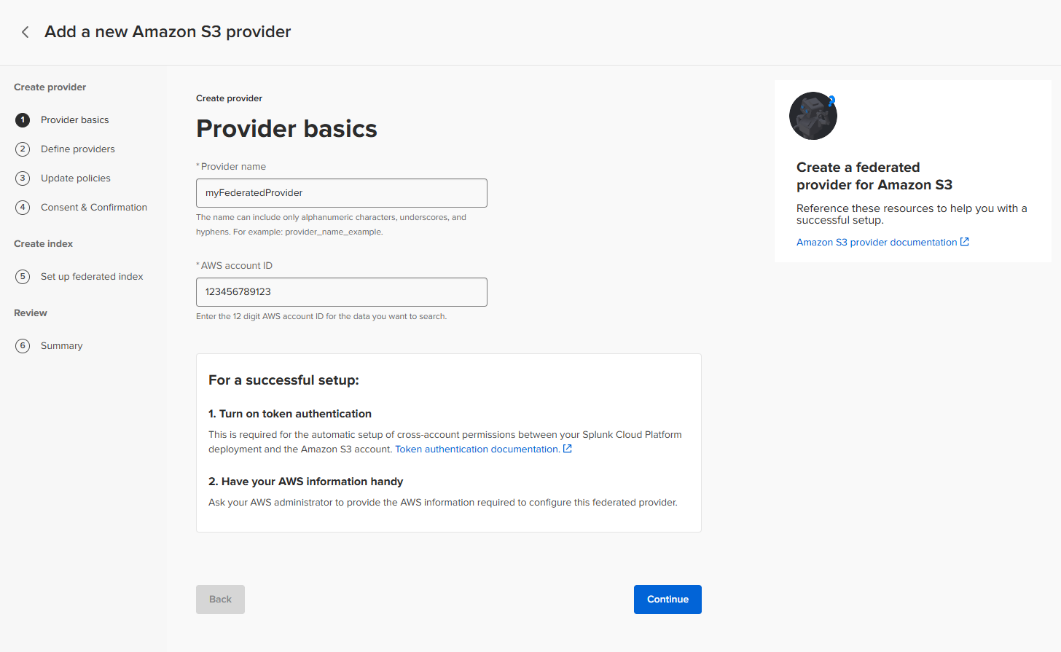
Provider basics
Enter a conforming Provider name and the AWS account ID for the account containing the AWS Glue Catalog, and then click Continue.
While the Glue Catalog must be in the same region as the Splunk Cloud tenant, the S3 buckets may exist in other regions. If S3 buckets are not in the same region as the Splunk Cloud Platform tenant, the account containing the S3 bucket might be subject to applicable inter-region data transfer fees.
Define providers
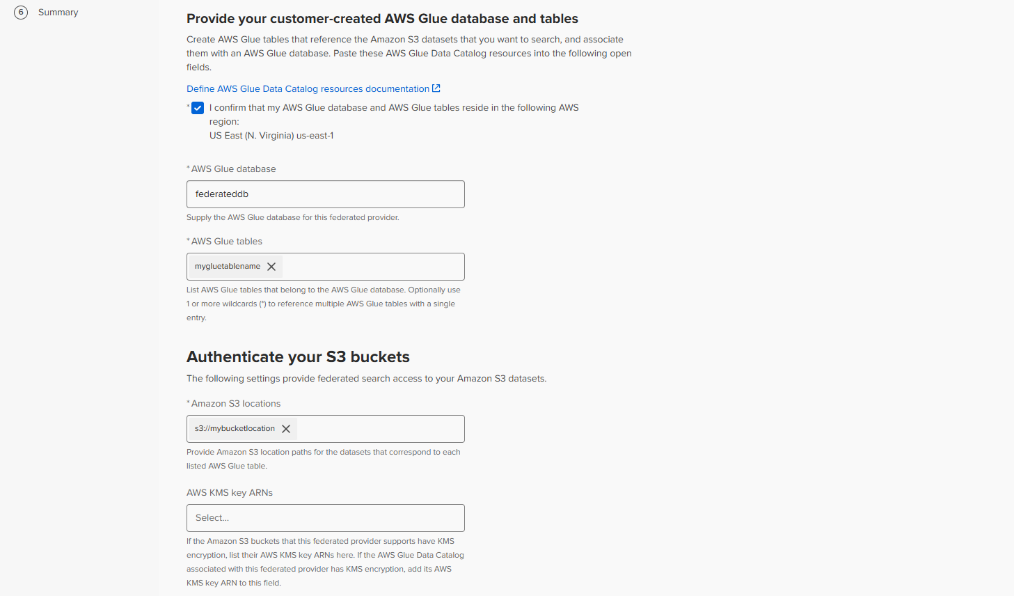
The Federated provider creation interface will advance to the Define Providers step. In this step:
- Click the box confirming that the AWS Glue database and tables are in the same region as the Splunk Cloud Platform instance.
- Type the AWS Glue database name. The database created through Athena in the previous section was
data_management_demo. - Type the AWS Glue table name in the AWS Glue tables input field and press Enter. The table created though Athena in the previous section was
zscaler. - Type the S3 location path in the Amazon S3 locations field and press Enter. Note that this should include any necessary folder names.
- If KMS is used, provide the AWS KMS key ARN in the AWS KMS key ARNs field and press Enter. KMS is not used in this example.
- Review and select the Agree checkbox for Warning and consent.
- Review and select the Agree checkbox for Confirmation that Requester Pays is turned off.
- Click Generate policy.
Update policies
After clicking Generate policy, an AWS Glue policy and a S3 Bucket policy will be generated and presented in the Splunk interface. These policies will need to be applied to the AWS Glue catalog and the Amazon S3 buckets.
You might have to expand the policy sections to see the generated policy. Both a Glue and a bucket policy will be created.
Update AWS Glue policy
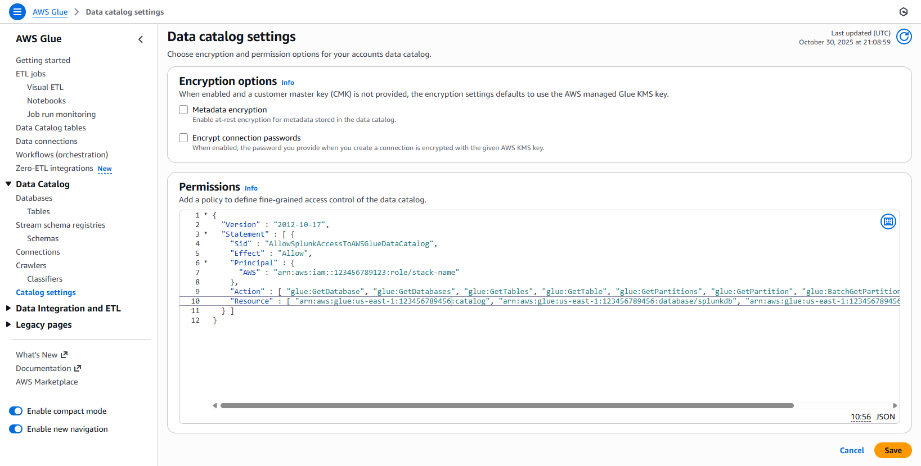
In this example, we’ll update the AWS Glue Policy in the AWS console.
- Open AWS Glue and click Catalog settings.
- If no existing permissions exist, paste the Splunk interface provided policy into the Permissions input box.
If existing permissions exist it might be necessary to merge the policies.
- Click Save.
Update Amazon S3 Bucket policy
The Amazon S3 bucket policy provided in the Splunk interface will need to be applied to the Bucket policy for the Amazon S3 bucket that contains data output by IP.
- Click Edit in the Bucket policy panel.
- If no existing permissions exist, paste the Splunk interface provided policy into the policy field.
If existing permissions exist it might be necessary to merge the policies.
- Click Save.
Complete provider creation
Return to the Splunk user interface and click Create provider to complete the provider creation.

You should see the following success message.
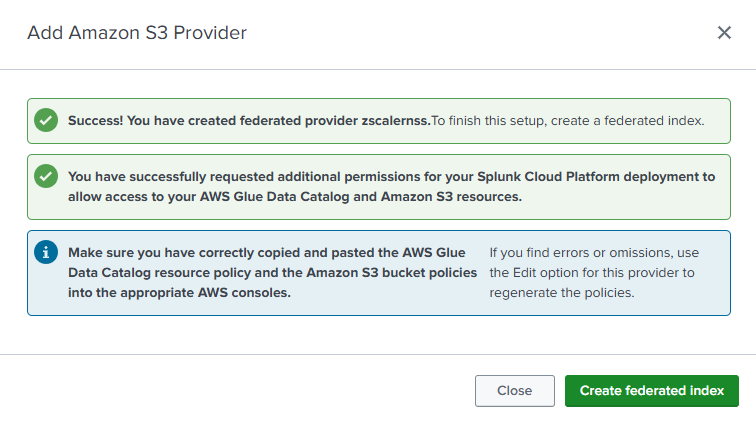
Create a Federated index
The Add Amazon S3 Provider success dialog box contains a link to Add Federated Index. Click Add federated index to begin creating a federated index for the Amazon S3 Provider.
If you accidentally clicked Close in the previous step, you can create the federated index this way:
- Click the Federated Indexes tab.
- Click Add Federated Index.
- Select For S3 provider.

Complete the following actions to create the federated index:
- Federated index details section
- Enter a federated index name into the input field. In this case, we’re using
zscaler. - Select the provider name created in the previous step in the Federated provider dropdown.
- For Remote Dataset:
- Select AWS Glue table (customer managed) for the Dataset type.
- Select zscaler for the Dataset name.
- Enter a federated index name into the input field. In this case, we’re using
- Time settings
- Enter time in the Time field.
- Enter "%s" in the Time format input box.
- Time partition settings
- Click Add new field.
- Enter partition_date in the Partition time field.
- Enter “year=%Y/month=%m/day=%d” for the Time format.
- Select String as Type.
- Select (GMT) Greenwich Mean Time as the Time zone.
Click Save to create the federated index.

Validate Federated search for Amazon S3 functionality
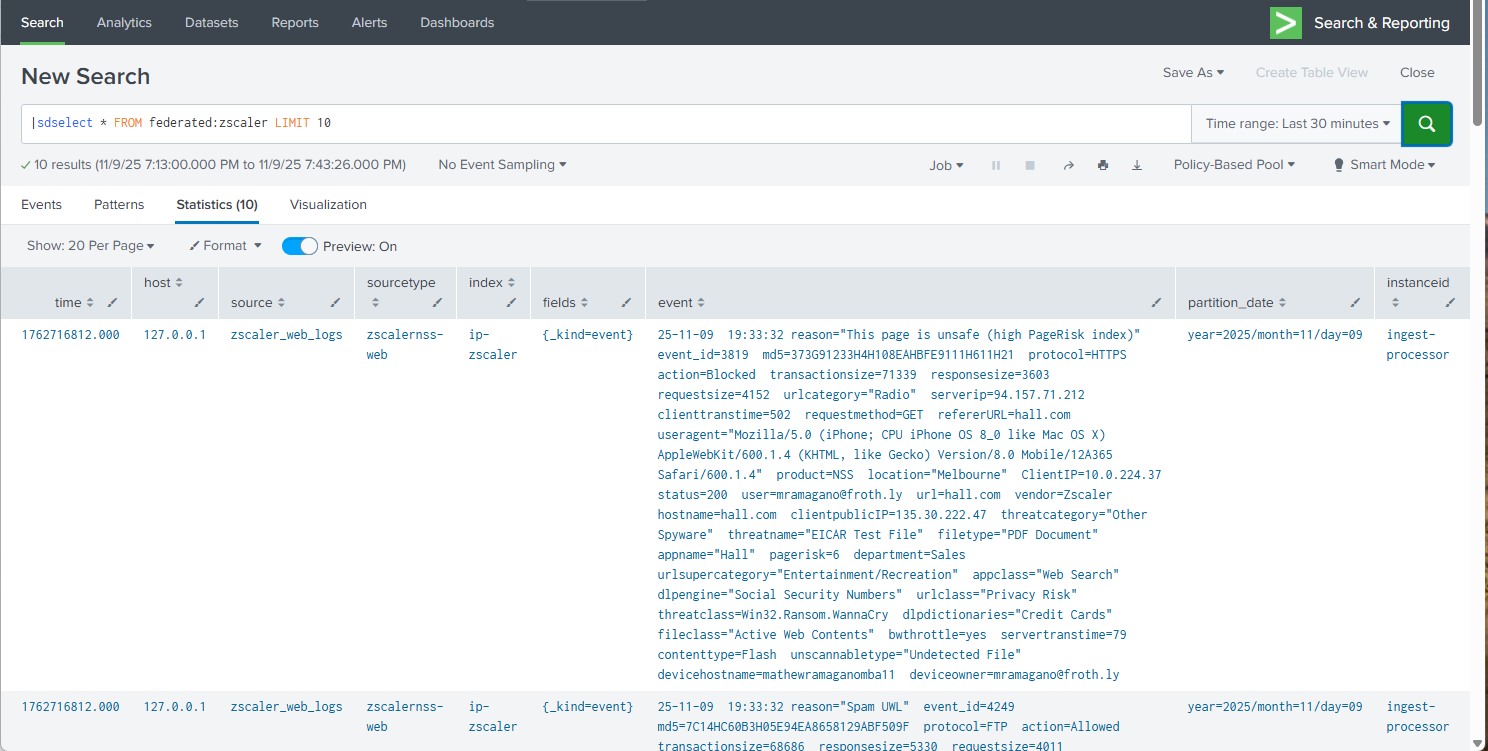
In the Splunk platform, open the Search and Reporting app and confirm that results are returned when running an sdselect command against the newly created federated provider. If sdselect syntax is unfamiliar to you, review the sdselect command usage documentation.
In this example query below note that:
- The Time range is set to the Last 30 minutes.
- All fields are being returned using the “*” to verify that results contain all expected fields.
- The LIMIT 10 clause limits the number of data scanned and returned to 10 events.
Use Federated Search for Amazon S3 to power a Splunk platform dashboard
As noted in the introduction, Federated Search for Amazon S3 can be a cost-effective alternative to searching Splunk indexes when search behaviors are of moderate frequency and relatively short lookback period. This section shows two approaches that can be used to help Federated Search for Amazon S3 support frequently access resources, like dashboards.
Use scheduled saved searches in dashboard panels
In this example, we’ll create a new report that uses a federated search to perform statistics on a data set returned from S3. We’ll reference the saved search result in a dashboard panel that refreshes every two hours. By using a saved search, cached results will be used on the dashboard, preventing subsequent dashboard loads from re-running and consuming further data scan units.
Create and schedule a report
The first step is to create a report. We’ll use the sdselect command in our search to search events in S3.
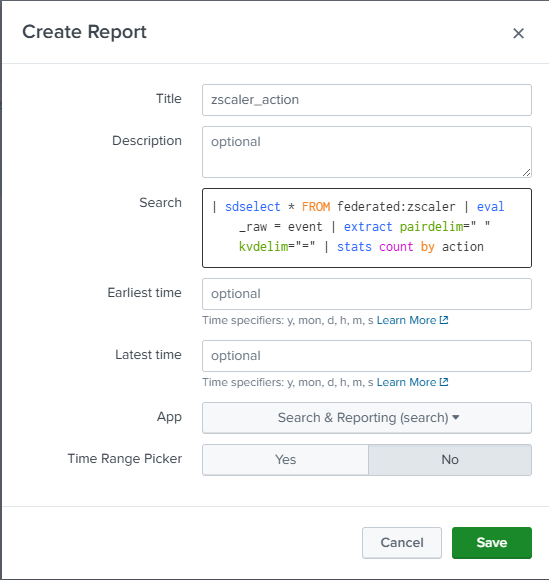
| sdselect * FROM federated:zscaler
The first part of the search returns the events from S3 in the specified time range for further processing in the Splunk platform.
| eval _raw = event | extract pairdelim=" " kvdelim="="
This eval statement replaces _raw with the HEC event field, then uses the extract command to extract the key value pairs.
| stats count by action
The stats count command is used to calculate the number of events with the Blocked or Allowed actions in the Zscaler data.
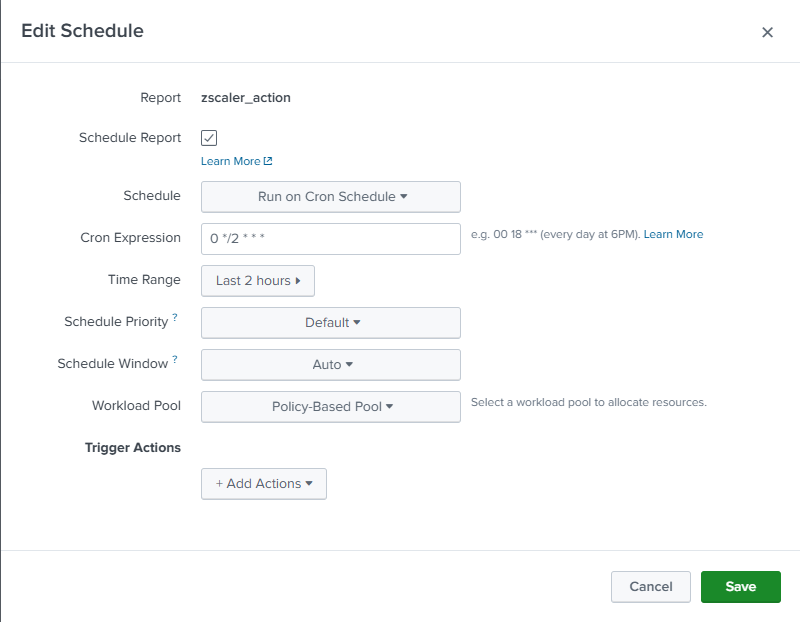
After creating the report, you'll need to create a schedule to cache results for use on your dashboard. This example runs the search every two hours with a two-hour time range (lookback).
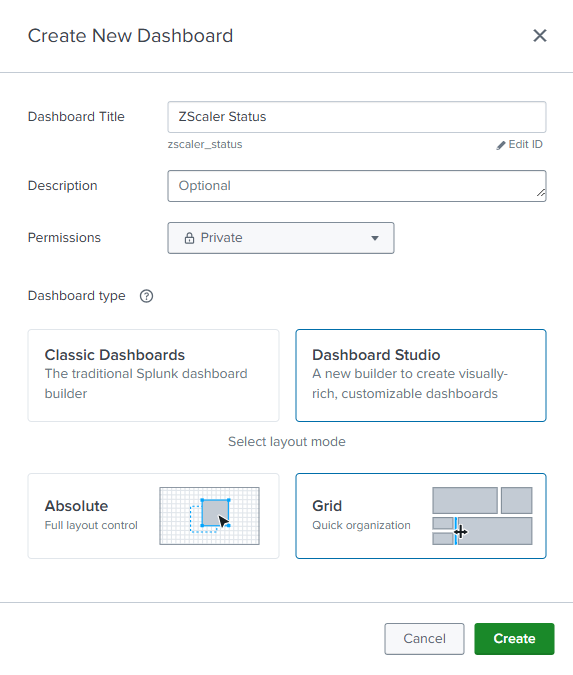
Create a dashboard
We’ll create a new Dashboard Studio Dashboard to visualize our results. We’ll call our dashboard "Zscaler Status".
Create data sources
After clicking Create on the dashboard, you’ll need to create a new new data source to connect to your new saved search.
- In Edit mode, click the Data source overview icon.

- In the Data source overview panel on the right side, click + Create search in the Search panel.
- In the SPL query box, use the
loadjobgenerating command to load the results of the most recent scheduled search, and then click Apply and close the dialog box.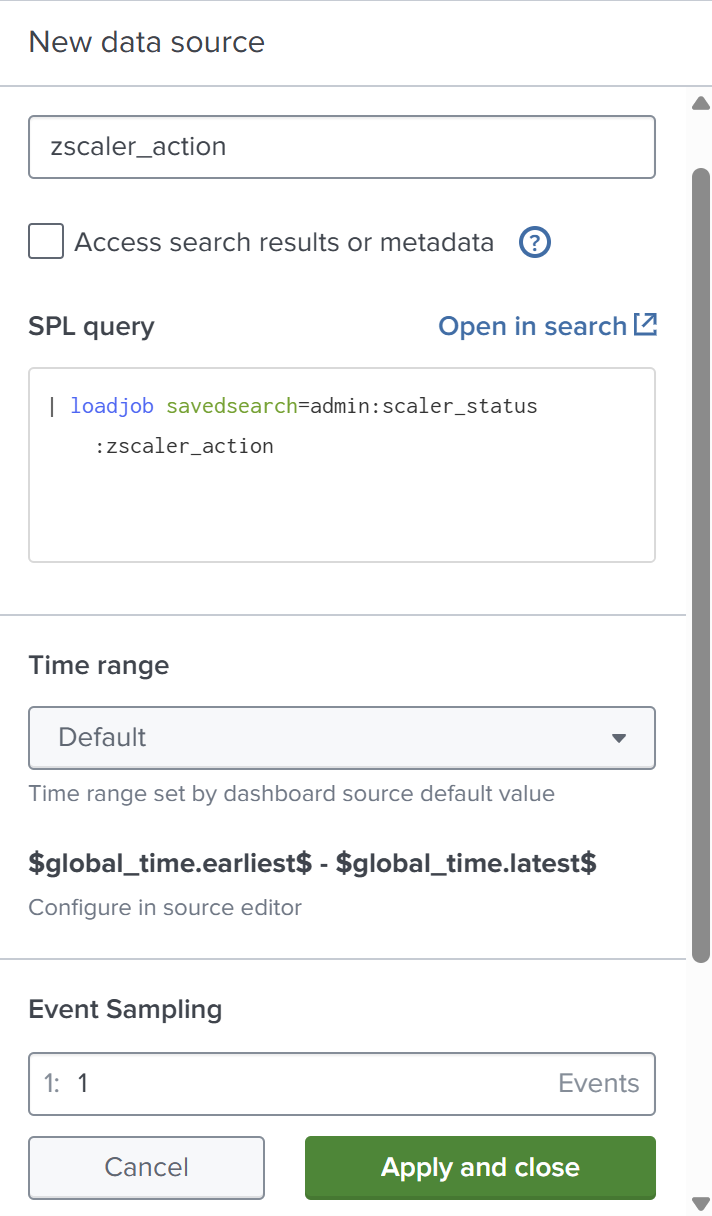
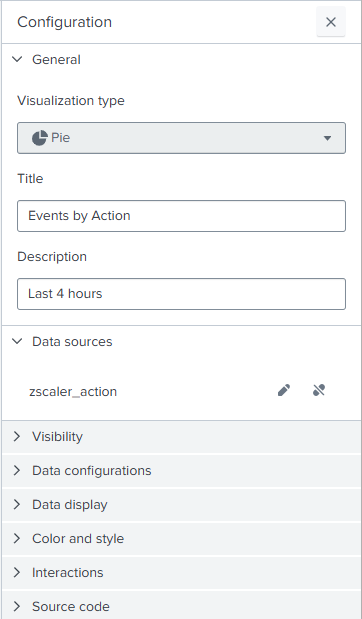
- Create a pie chart visualization in a new dashboard panel to present the results.
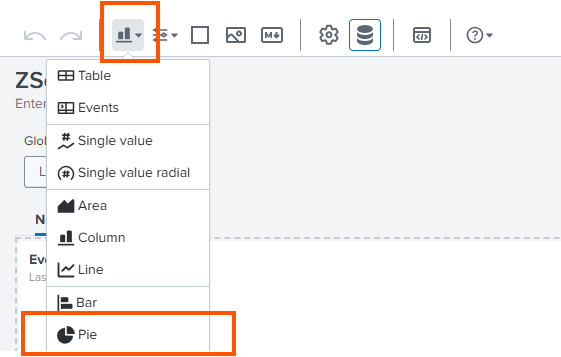
- In the Data sources field, select zscaler_action.
Use saved searches and summaries to present trends
In this example, we’ll create a new report that uses a federated search to perform statistics on a data set returned from S3 and writes those results to a summary index that can be used in the Zscaler dashboard. By writing to a summary index, previously scanned data persists over the summary period, allowing for subsequent searches to look back over longer periods of time without further consuming scan units.
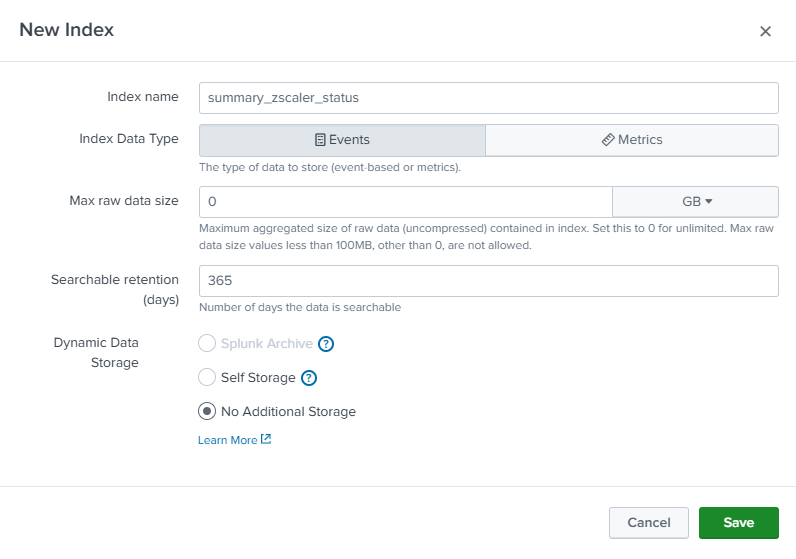
Create a summary index
First, create an index that will be used to contain your summary data with the index name of summary_zscaler_status.
Create and schedule reports
Use the example values shown in the following screenshot and the search explanation below to do this.
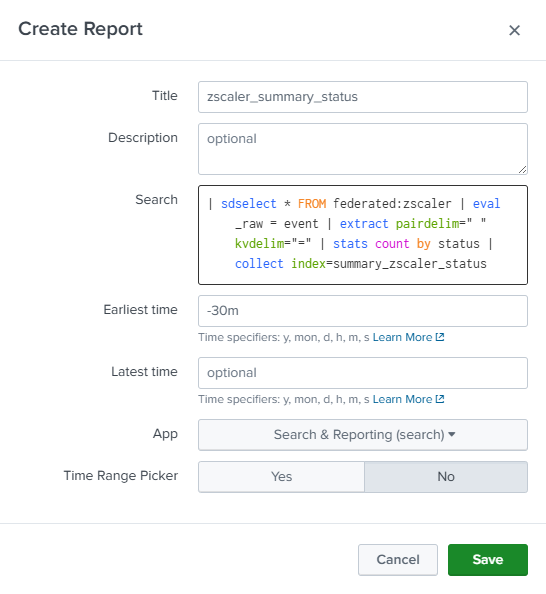
| sdselect * FROM federated:zscaler
The first part of the search returns the events from S3 in the specified time range for further processing in the Splunk platform.
| eval _raw = event | extract pairdelim=" " kvdelim="="
This eval statement replaces _raw with the HEC event field, then uses the extract command to extract the key value pairs.
| stats count by action
Next, use a stats command to count the number of events by status code.
| collect index=summary_zscaler_status
Finally, use the collect command to write the stats to a summary index. We’ll use this summary index to populate a dashboard panel.
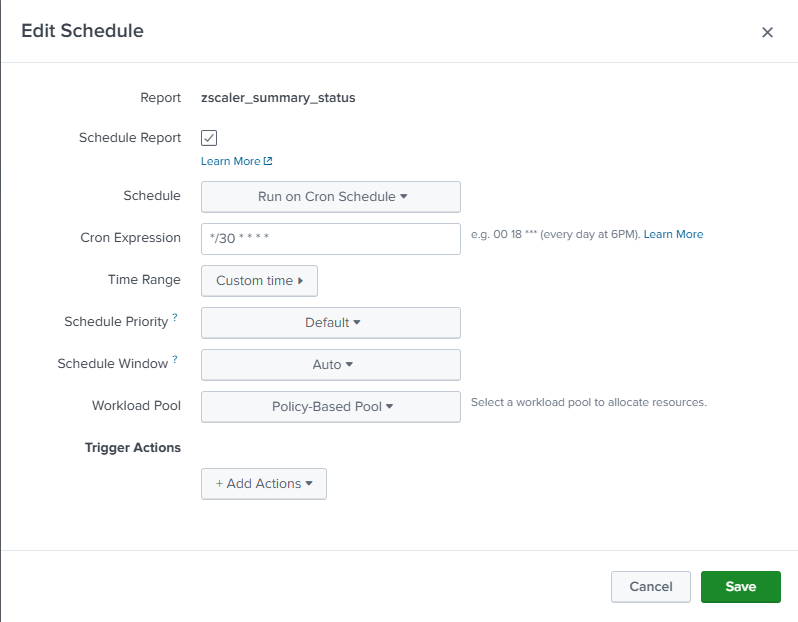
The next step is to schedule our report to run every 30 minutes. Note that we’re using a 30 minute lookback and running our search every 30 minutes.
Create data sources
After clicking create on your report, you'll need to create a new data source to connect to your new saved search.
- In Edit mode, click the Data source overview icon.

- In the Data source overview panel on the right side, click + Create search in the Search panel.
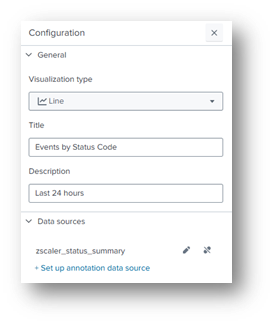
- In the New data source panel, enter a Data source name. The example below uses
zscaler_status_summary. Continue by authoring a new SPL query that generates a timechart of the status values from our summary index. Set the Time range, and then click Apply and close the dialog box.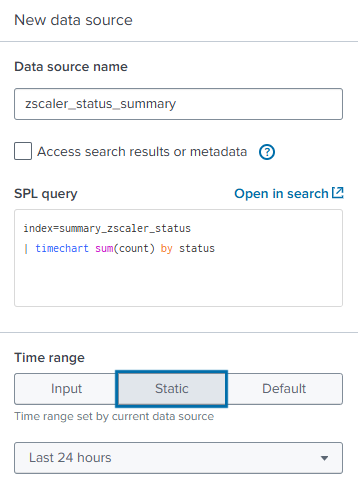
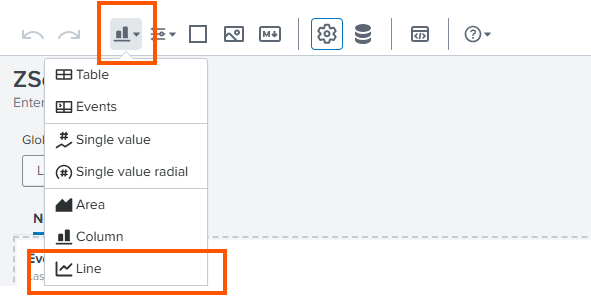
- Create a line chart visualization in a new dashboard panel to present the results.
- In the Data sources field, select zscaler_action.
Dashboard
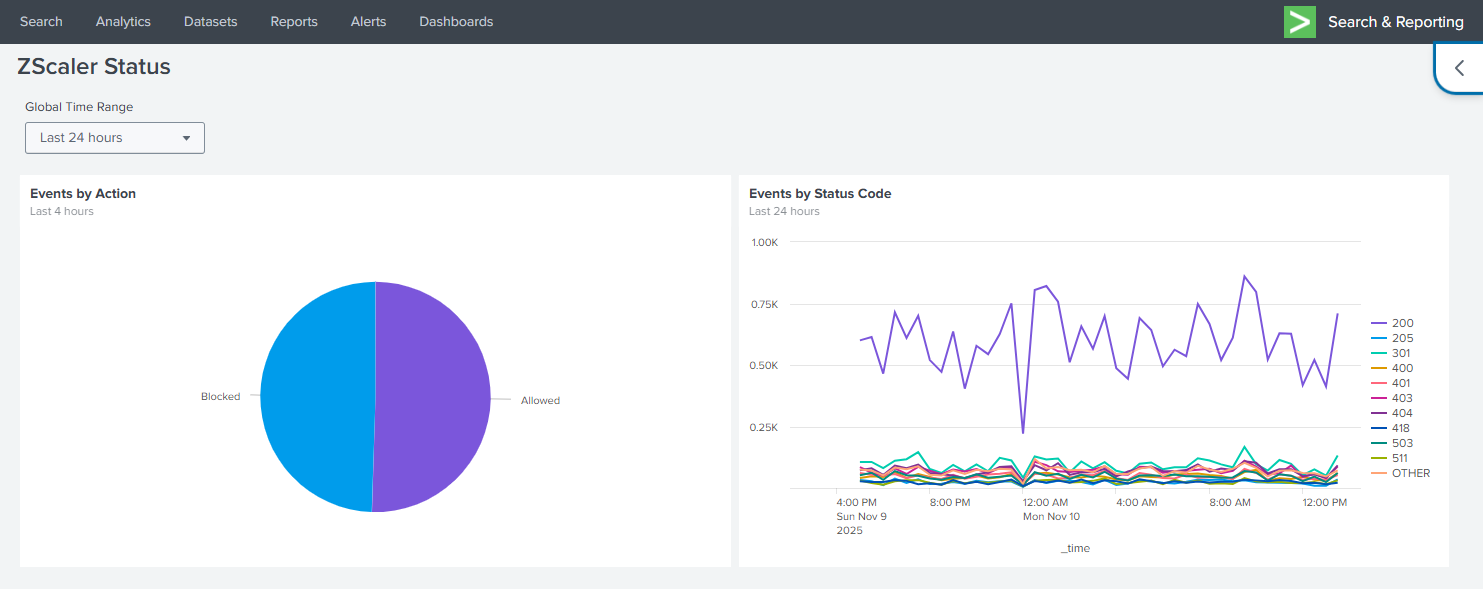
After our saved searches have had an opportunity to populate data in our summary index, the dashboard should be like the one shown below.
- The pie chart in the panel on the left is driven though reuse of the cached saved search results.
- The line chart in the right panel uses the summary results from our scheduled search to allow the user to view recent and historical results.
Use of these strategies facilitate dashboard population using regular refresh intervals without ever ingesting the data into the Splunk platform.
Summary
In this article we examined implementing Federated Search for Amazon S3 for use cases that might have been considered only supportable through traditional Splunk indexes, such as threat reporting and monitoring.
The dashboard is powered by data that has never been ingested into the Splunk platform. Through federation and common caching and summary techniques, we demonstrated how we can expose data to our users through dashboards using cost effective methods.
Federated Search for Amazon S3 allows you to directly search the data in your S3 buckets from Splunk Cloud Platform, supporting ad-hoc based security investigations, reporting, and alerting through scheduled searches—without the cost and complexity of ingesting the data.
Next steps
These resources might help you understand and implement this guidance:
- Splunk Lantern Article: Partitioning data in S3 for the best FS-S3 experience
- Splunk Lantern Article: Using federated search for Amazon S3 with Edge Processor
- Splunk Lantern Article: Using federated search for Amazon S3 with ingest actions
- Splunk Help: Ingest actions
- Splunk Help: Federated Search for S3