Streamlining threat reporting, dashboarding, and alerting with Federated Search for Amazon S3
Your company manages thousands of cloud assets, each producing large volumes of logs every day. For your security operations team, continuous monitoring is crucial to detect threats, identify trends, and provide actionable intelligence to leadership.
In the past, analyzing historical activity required expensive and slow data ingestion, making it difficult to spot long-term patterns or quickly deliver executive reports. You need a more efficient and scalable solution for threat visibility.
To see this use case in action, open the click-through Demo: Federated Search for Amazon S3 use cases and select the Threat Reporting, Dashboarding & Alerting use case.
Data required
How to use Splunk software for this use case
With Splunk Federated Search for Amazon S3, you can improve your monitoring processes by running scheduled searches and creating summary indexes directly on historical S3 logs. These searches look for signs of malicious activity like spikes in failed logins, unfamiliar outbound connections, or repeated access to sensitive resources. These searches work alongside live Splunk Cloud Platform data, offering a complete, unified view.
Searches you can run include:
- ► Populate a summary index with failed logins from S3
-
This search extracts, normalizes, and enriches failed login events from S3 CloudTrail logs, then stores this processed data in a summary index for efficient and cost-effective reporting and analysis.
| sdselect eventtime eventname eventsource errorcode errormessage sourceipaddress awsregion useragent recipientaccountid requestid eventid FROM federated:flaws_cloudtrail_parquet_logs
| where eventsource="signin.amazonaws.com" OR eventname IN ("ConsoleLogin","consolelogin","Login","login")
| eval timestamp=eventtime
| eval hostname=sourceipaddress
| eval eventtype="authentication"
| eval status=case(match(errormessage,"(?i)success"),"success", isnull(errorcode) AND isnull(errormessage),"success", match(errormessage,"(? )fail|denied|unauthor|expired|invalid"),"failed", match(errorcode,"(?i)fail|unauthor|accessdenied|expired|invalid"),"failed", true(),"unknown")
| eval reason=if(isnotnull(errorcode), errorcode, errormessage)
| join type=left max=0 sourceipaddress
  [ | inputlookup cisco-asa.csv
  | rename src_ip AS ip
  | fields ip
  | append [ | inputlookup cisco-asa.csv | rename dest_ip AS ip | fields ip ]
| where isnotnull(ip) AND ip!=""
| dedup ip
| rename ip AS sourceipaddress
| eval asa_seen="yes" ]
| eval asa_seen=if(isnull(asa_seen),"no",asa_seen)
| fields timestamp hostname eventtype eventname reason status sourceipaddress useragent awsregion recipientaccountid requestid eventid asa_seen
| collect index=summary_logins addtime=true sourcetype="summary:cloudtrail_logins" marker="cloudtrail_all_logins"
The search returns results that look like this:

- ► Spikes in failed logins
-
This search analyzes daily failed login counts from S3 CloudTrail logs, calculates deviations from the average, and identifies significant spikes that could indicate emerging security incidents.
| sdselect eventtime eventname eventsource errorcode errormessage sourceipaddress awsregion useragent recipientaccountid requestid eventid useridentity FROM federated:flaws_cloudtrail_parquet_logs WHERE eventname = "ConsoleLogin" AND eventsource = "signin.amazonaws.com" AND errormessage != ""
| eval _time = strptime(eventtime, "%Y-%m-%dT%H:%M:%SZ")
| bucket _time span=1d
| stats count AS failed_logins, dc(sourceipaddress) AS unique_source_ips, dc(useridentity) AS unique_users, values(errormessage) AS error_messages BY _time awsregion
| eventstats sum(failed_logins) AS total_failed_logins, avg(failed_logins) AS avg_failed_logins_per_bucket,
| eval percent_of_total = round((failed_logins / total_failed_logins) * 100, 2)
| eval deviation_from_avg = failed_logins - avg_failed_logins_per_bucket
| sort - _time
The search returns results that look like this:

- ► Top 10 IPs with failed logins
-
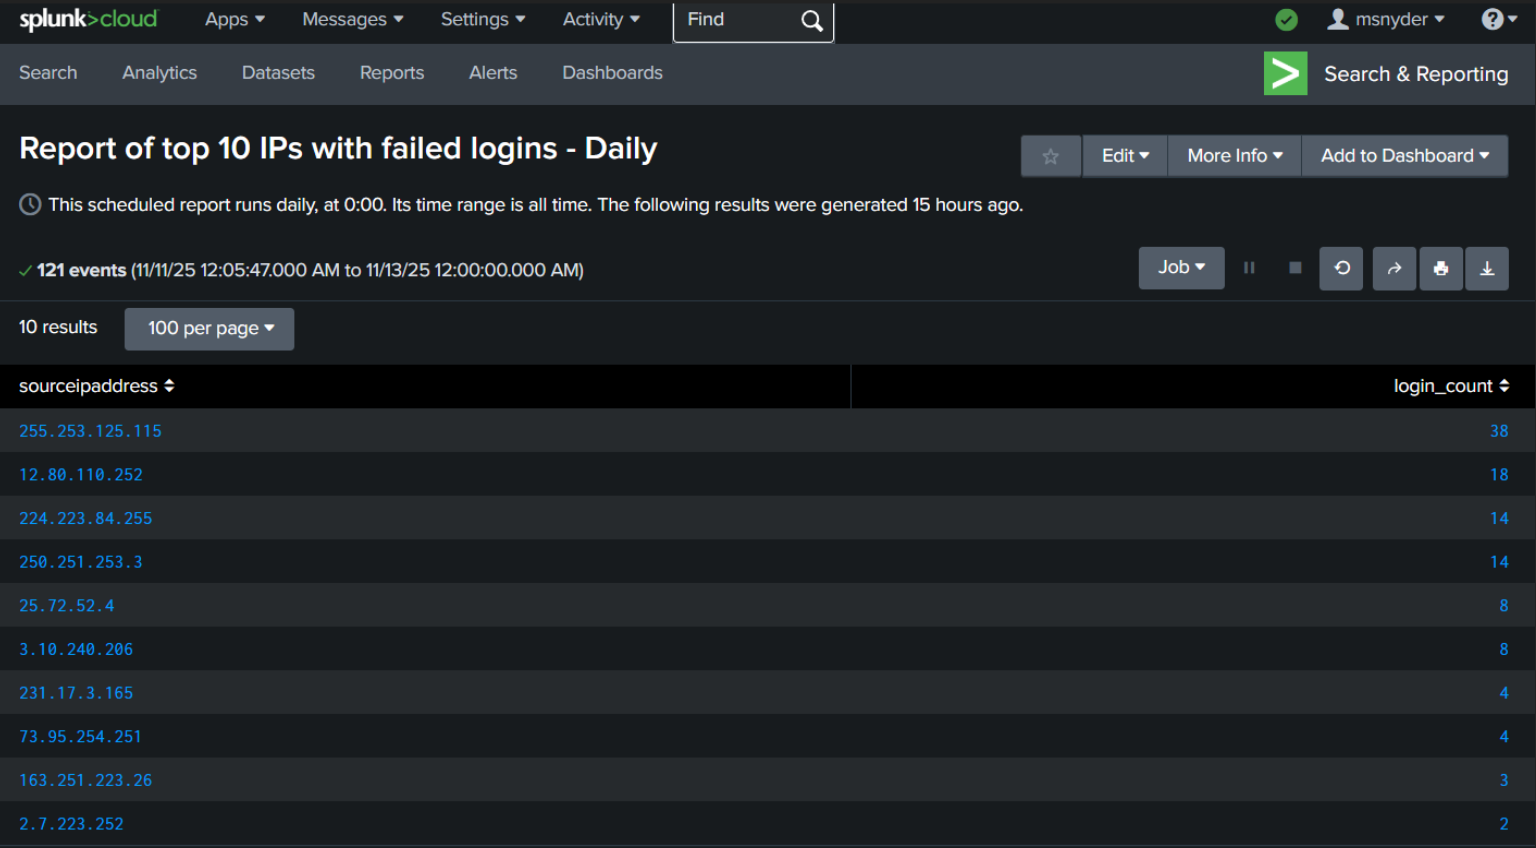
This search retrieves the top 10 source IP addresses responsible for the highest number of failed login attempts from the pre-populated summary index, aiding in the identification of potential brute-force attacks.
index=summary_logins sourcetype="summary:cloudtrail_logins"
| where isnotnull(sourceipaddress) AND sourceipaddress!=""
| stats count AS login_count BY sourceipaddress
| sort - login_count
| head 10
The search returns results that look like this:
Next steps
You set up these queries to run as hourly and daily scheduled searches to track and detect unusual spikes in failed login activity. When an anomaly is detected, the system automatically generates an alert for immediate investigation. You can quickly examine the relevant historical data without waiting for lengthy ingestion processes. At the same time, summary reports and executive dashboards update automatically, giving leadership up-to-date insight into the organization's security status.
Dashboards you can build can include elements like the examples below:


To get started, sign up for the Federated Search for Amazon S3 free trial.
In addition, these resources might help you understand and implement this guidance:
- Splunk Help: About Splunk Federated Search for Amazon S3
- Splunk Lantern Article: Leveraging Federated Search for Amazon S3 for key security use cases
- Splunk Lantern Article: Using Federated Search for Amazon S3 for monitoring and detection
- Splunk Lantern Article: Partitioning data in S3 for the best FS-S3 experience
- Splunk Lantern Article: Using Federated Search for Amazon S3 with Edge Processor
- Splunk Lantern Article: Using Federated Search for Amazon S3 with ingest actions