Checking for sizing adherence
This activity assesses the current adherence to the Splunk User Behavior Analytics (UBA) sizing guidelines for the UBA cluster and determines if a resize of the cluster is needed. This procedure is valid as of UBA version 5.3.0.
This article is part of the Splunk User Behavior Analytics Owner's Manual, which describes the recommended ongoing maintenance tasks that the owner of a UBA implementation should ensure are performed to keep their implementation functional. To see more maintenance tasks, click here to see the complete manual.
Why is this important?
Splunk User Behavior Analytics has very strict sizing guidelines that govern the number of nodes required for a cluster to function correctly in a given environment. There are several different sizing metrics that form part of these guidelines, including peak events per second on ingested data, number of accounts monitored, number of devices monitored, and number of data sources. When a UBA cluster is created, it is sized on each of these metrics; the cluster must be sized to cater for the largest requirement across all of these metrics to function correctly.
Quite often, these metrics will change over time as new accounts, new data sources or new devices are introduced into an environment. This can push a UBA cluster over the sizing thresholds and cause unexpected behaviors or malfunctions in the UBA cluster. If UBA experiences data volumes exceeding what it is sized for the cluster will begin to drop data, as the machine learning models do not have enough compute power to keep up with data volumes.
Continuous monitoring of adherence to the sizing guidelines is critical to ensuring the ongoing function of a UBA cluster. Over time, the metrics that determine cluster sizing can have a tendency to grow naturally as part of overall business growth. This process can go unnoticed by the UBA administrator without active monitoring. When a UBA cluster is operating outside its sizing limitations, the completeness of detections cannot be guaranteed; therefore, it is an important ongoing activity to monitor these metrics.
Schedule
Every three months
Prerequisites
An admin account is required to access admin interfaces required to gather some of the listed information from the UBA cluster.
Notes and Warnings
- All metrics presented in the sizing guidelines are based on peak values, rather than the average. It is important to perform this activity at a time representing this state, generally a weekday. Performing this activity on a weekend may result in under-reported sizing results.
- When resizing a cluster, consider catering for an extra 20 percent headroom in the cluster size to allow for further growth and expansion without having to resize the cluster again.
Procedure
If you prefer to follow along with this procedure in video format, click here to jump to the bottom of this page.
Step 1: Identify the current size of the UBA cluster
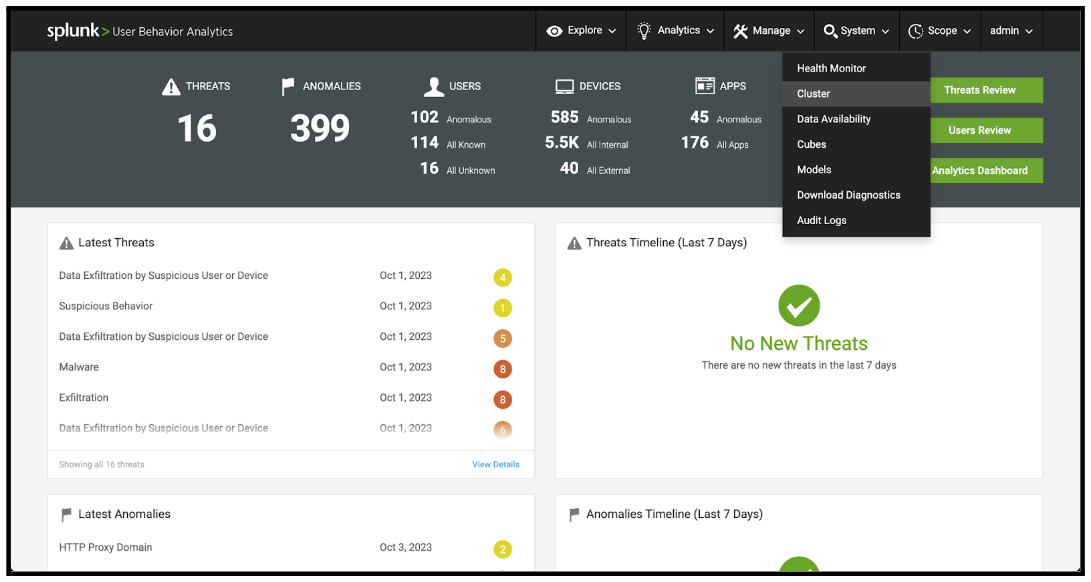
- On the main page of your UBA environment, in the menu bar at the top right of the page, click System, then select Cluster from the drop-down menu that appears.
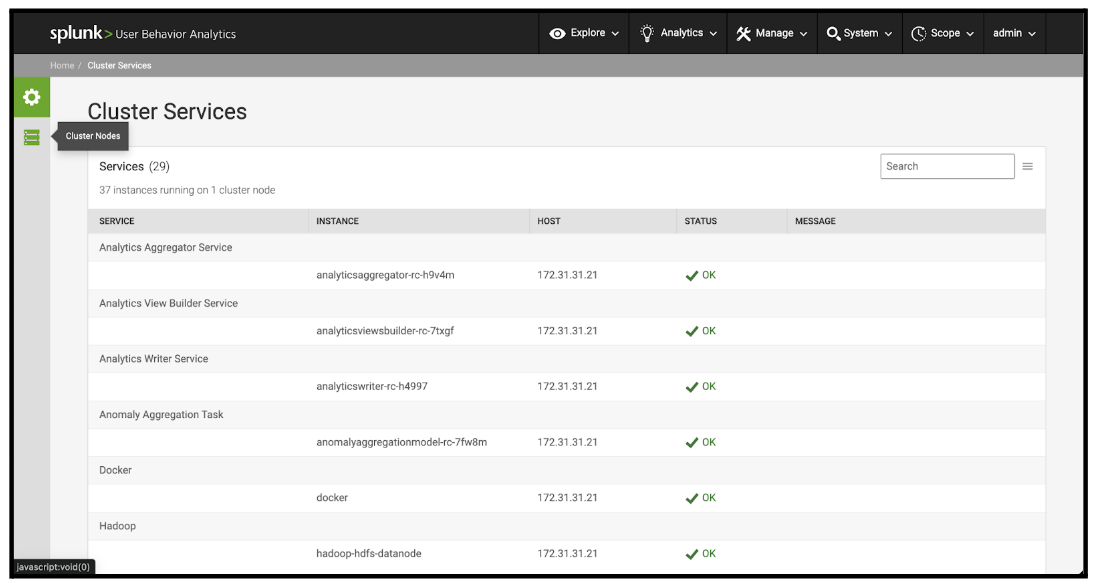
- On the Cluster Services page, on the left-hand side of the screen, click the second icon down. If you hover your cursor over this icon, it is labeled Cluster Nodes.
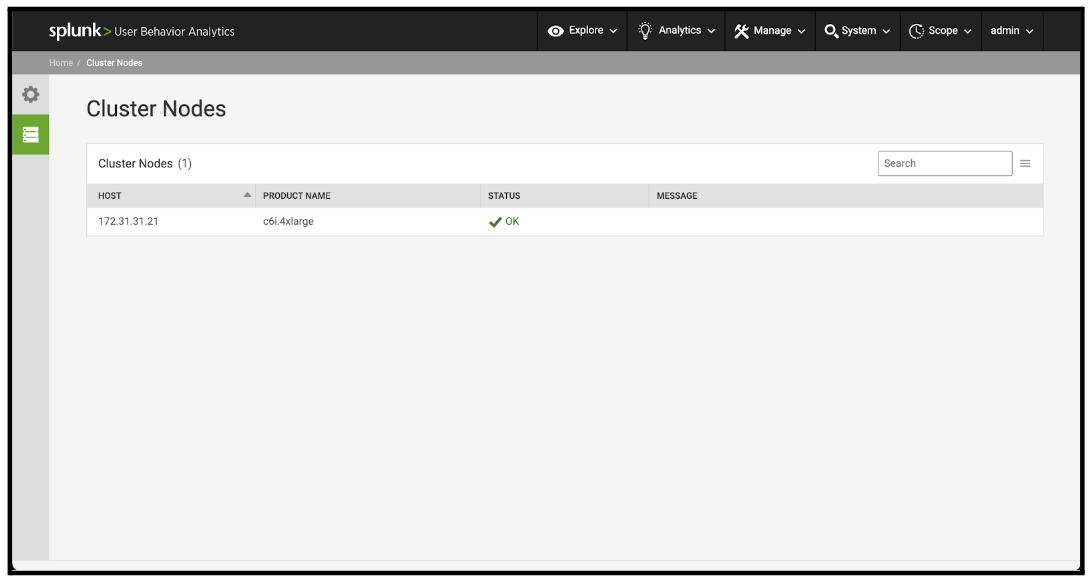
- On the Cluster Nodes page, look at the number in brackets at the top of the table after the words Cluster Nodes. Record this Cluster Nodes number somewhere that it can be referenced later as it will be referred to in subsequent steps. This number indicates the size of the UBA cluster. The individual cluster nodes are represented on the table below this number.
Step 2: Assess the current peak EPS
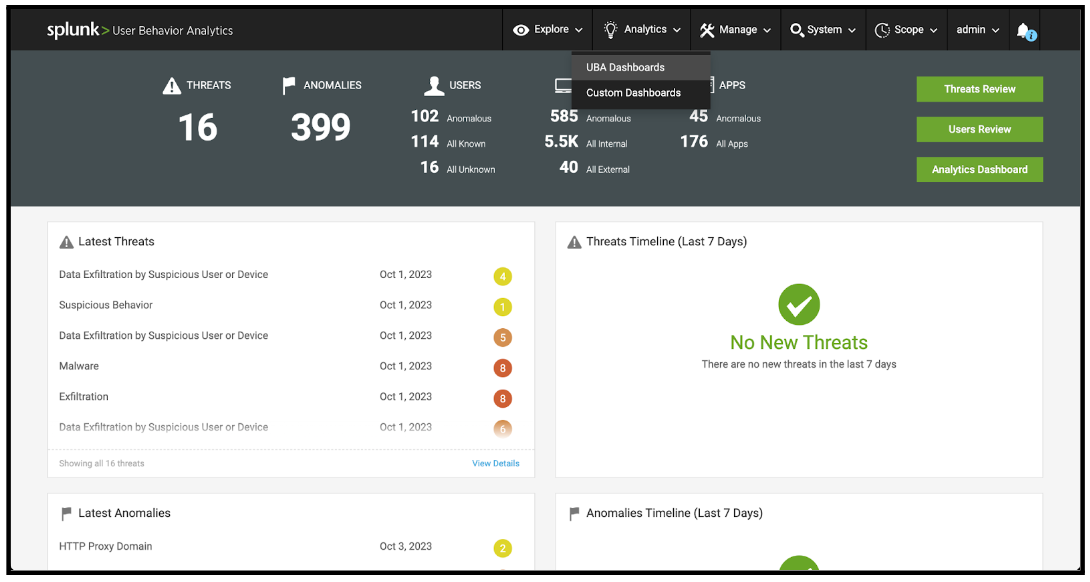
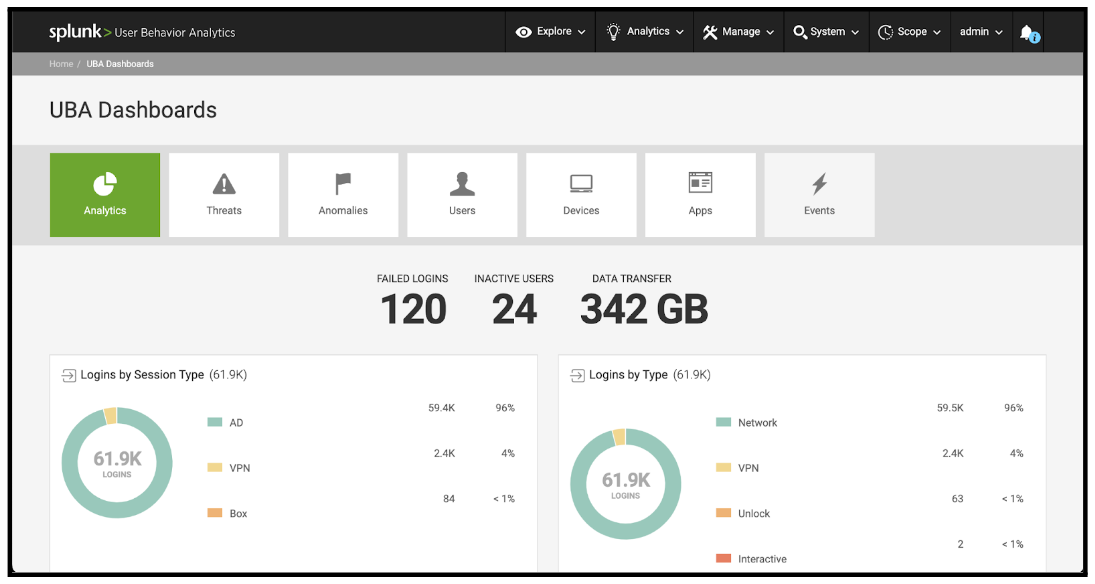
- On the main page of your UBA environment, in the menu bar at the top right of the page, click Analytics, then select UBA Dashboards from the drop-down menu that appears.
- On the UBA Dashboards page, click the right-most item at the top of the page labeled Events.
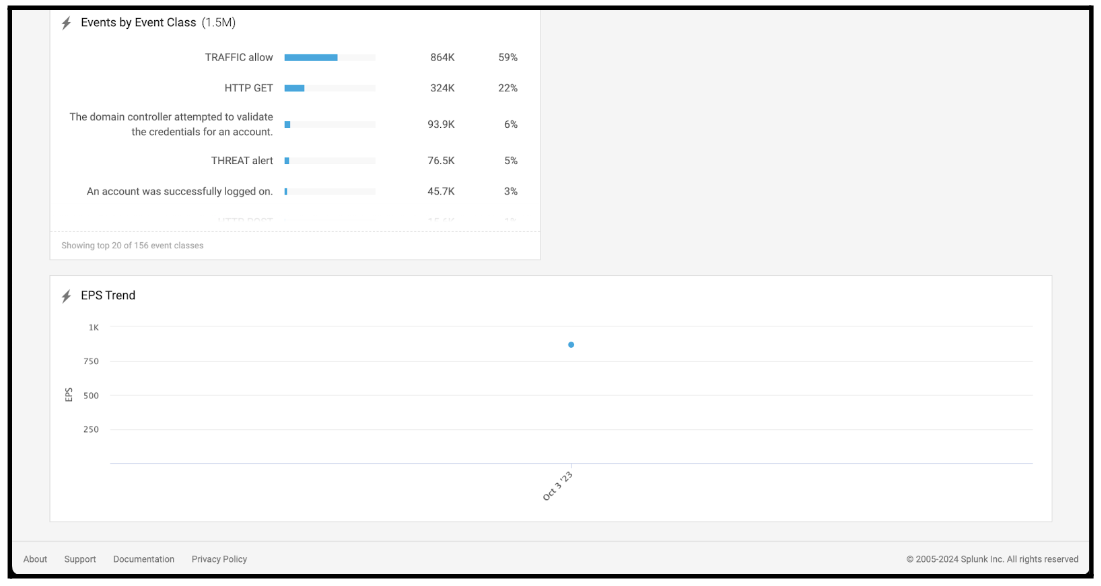
- Scroll to the bottom of this page to the EPS Trend dashboard panel. Hover the cursor over the highest point of the graph in this panel and look at the number that appears. Record this Peak EPS number somewhere that it can be referenced later as it will be referred to in subsequent steps. This number represents the peak EPS that the UBA cluster has experienced.
Step 3: Assess current monitored accounts
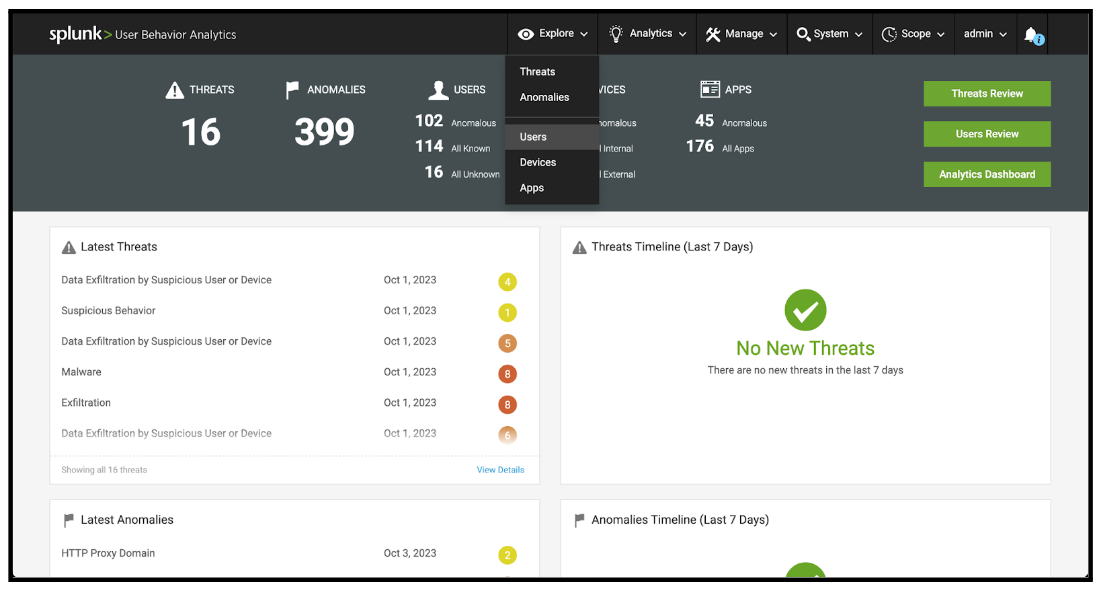
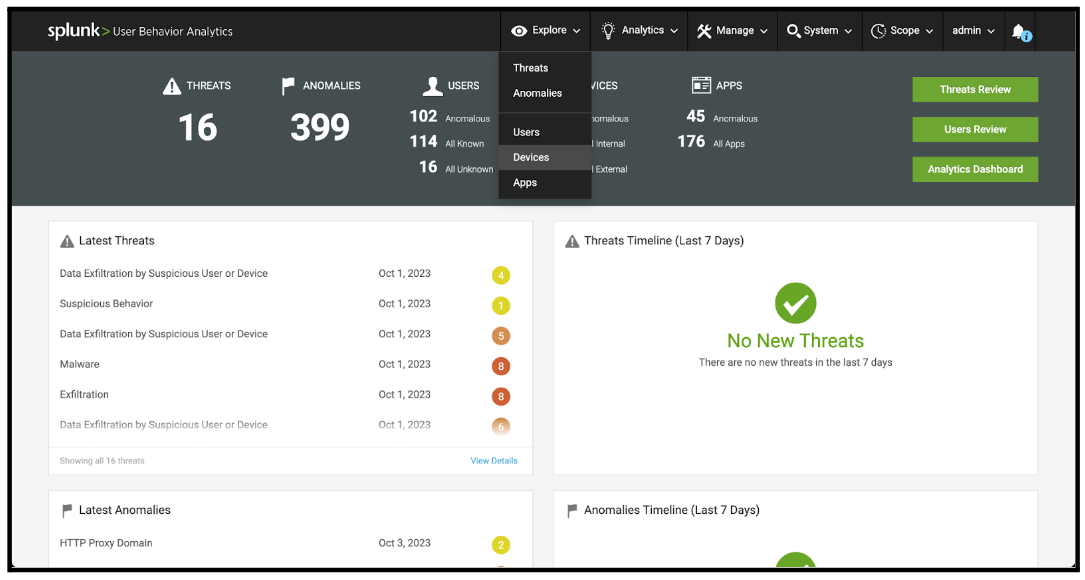
- On the main page of your UBA environment, in the menu bar at the top right of the page, click Explore, then select Users from the drop-down menu that appears.
- On the Users Table page, look at the box at the top left of the page under the Users Table title. If it says ‘All Users’ skip to the next step. Otherwise, click the box and select All Users from the subsequent dropdown menu.
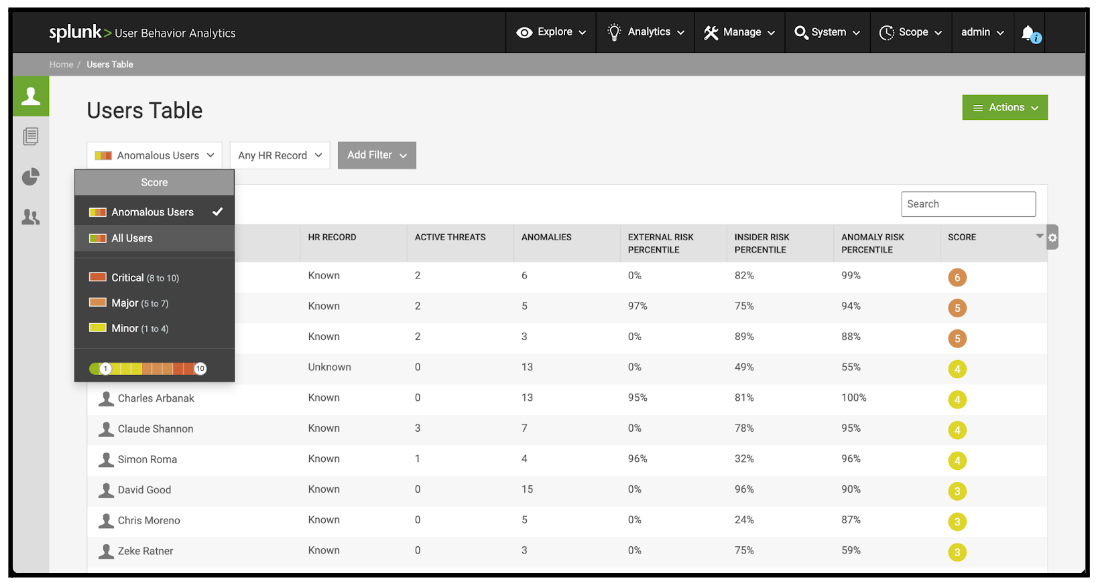
- Look at the number that is in brackets at the top of the table after the Users table title. Record this Peak Users number somewhere that it can be referenced later as it will be referred to in subsequent steps. This number represents the number of monitored accounts in UBA.
Step 4: Assess current monitored devices
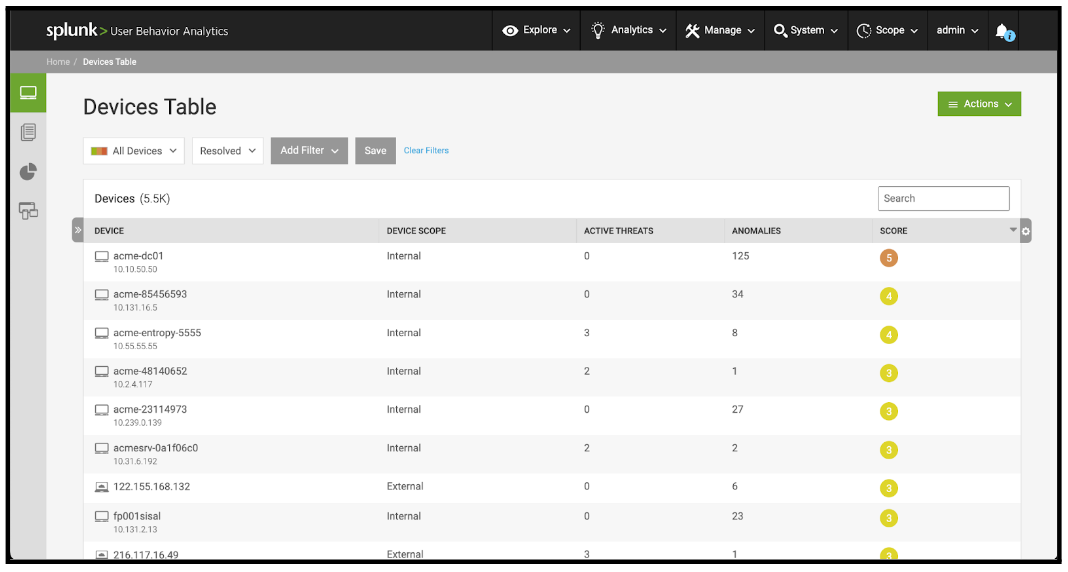
- On the main page of your UBA environment, in the menu bar at the top right of the page, click Explore, then select Devices from the drop-down menu that appears.
- From the Devices Table page, look at the box at the top left of the page under the Devices Table title. If it says All Devices skip to the next step. Otherwise, click the box and select All Devices from the subsequent dropdown menu.
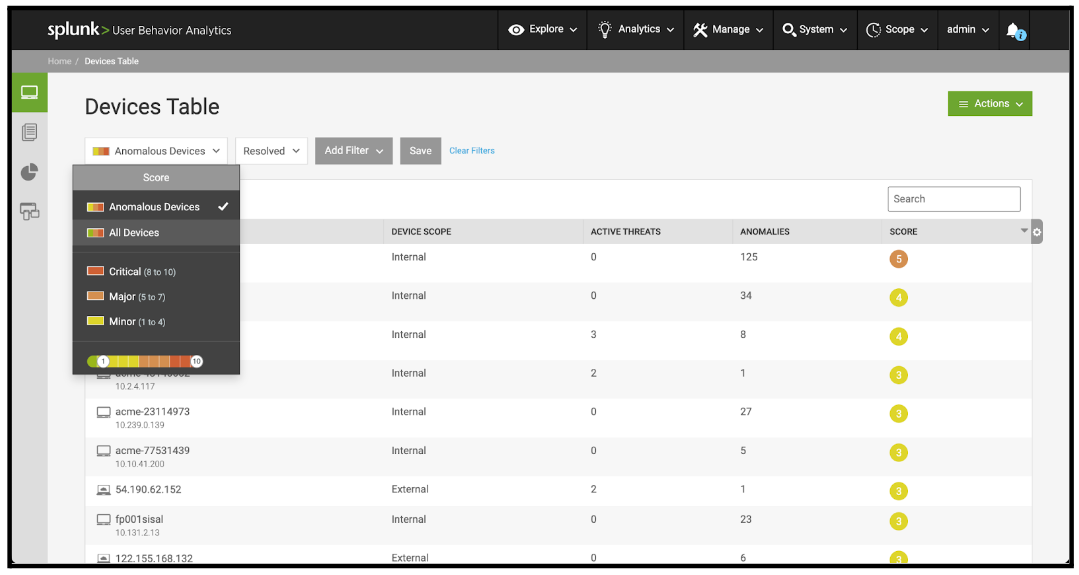
- Look at the number that is in brackets at the top of the table after the Devices table title. Record this Peak Devices number somewhere that it can be referenced later as it will be referred to in subsequent steps. This number represents the number of monitored devices in UBA.
Step 5: Assess currently configured log sources
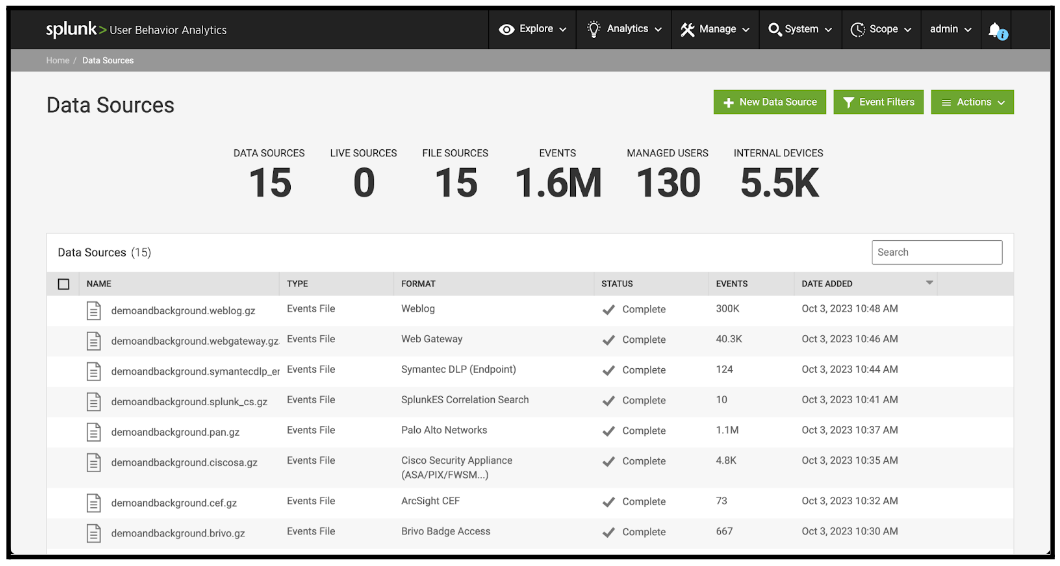
- On the main page of your UBA environment, in the menu bar at the top right of the page, click Manage, then select Data Sources from the drop-down menu that appears.
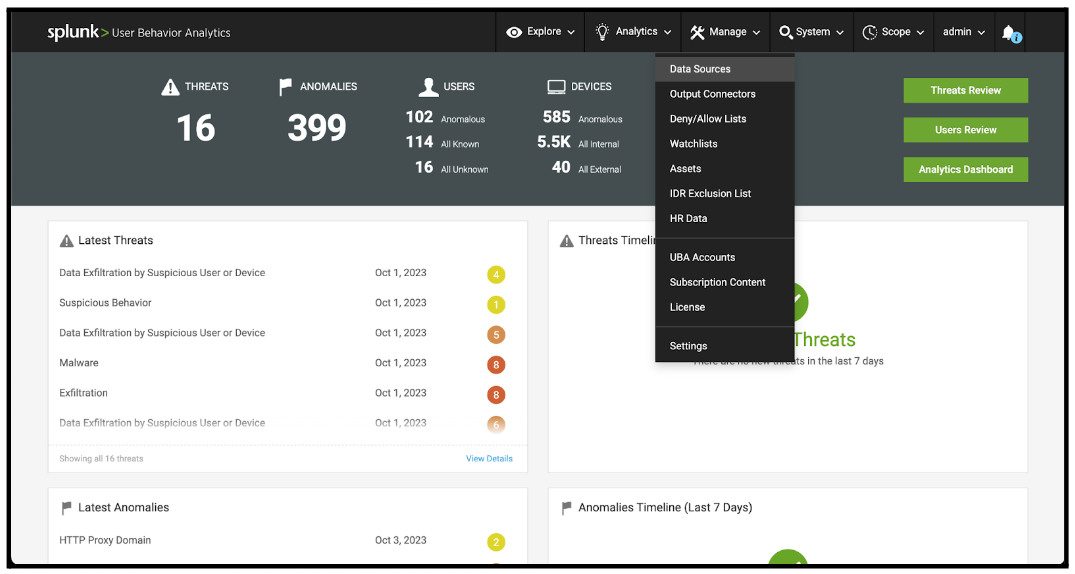
- Look at the Data Sources number on the top left of the page. Record this Data Sources number somewhere that it can be referenced later as it will be referred to in subsequent steps. This number denotes the number of configured data sources for the UBA cluster.
Step 6: Calculate the required cluster size
- The collected information is now compared to the UBA sizing table to calculate the required cluster size based on the current sizing metrics. The UBA sizing table can be found in Scaling your Splunk UBA deployment in Splunk Help. An example of the table is also provided below, as at UBA version 5.3.0:
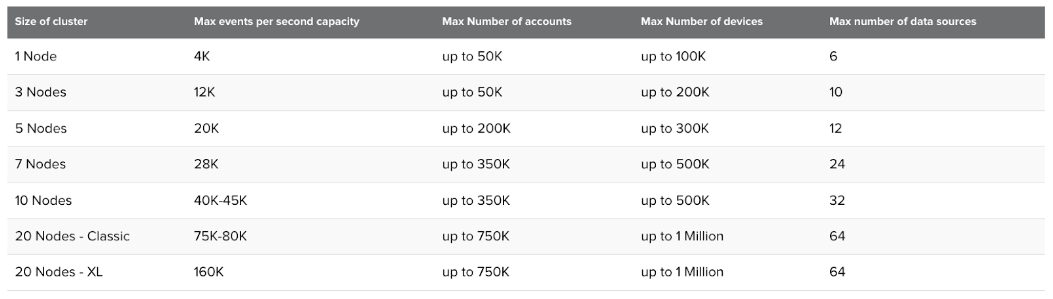
- After the ideal cluster size has been identified, compare this to the current cluster size gathered in the first step of this procedure. If the current cluster size is smaller than the ideal cluster size that has been identified, a resizing of the UBA cluster must be undertaken. If you require assistance with this activity, contact your Splunk account team to engage professional services support.
Video walkthrough
In the following video, you can watch a walkthrough of the procedure described above.
Next steps
These resources might help you understand and implement this guidance:
- Splunk Help: Scaling your Splunk UBA deployment
- Splunk Lantern Article: Splunk User Behavior Analytics Owner's Manual