Sending Splunk Observability events as Alert Actions from Splunk Enterprise Security
It can be helpful for Splunk Observability Cloud users to be identified of issues in Splunk Enterprise Security, even if they don't have access to use Splunk Enterprise Security. An Splunk Observability Cloud Alert Action can be used to send those users a notification. For example, you could send your developers a notification that a possible admin login brute force attack has been identified in GitHub by Splunk Enterprise Security.
This is only one example use case. Another common use case is notifying developers in Splunk Observability Cloud of DDOS attacks identified by Splunk Enterprise Security. You can use this same method to pass context from Splunk Enterprise Security to Splunk Observability Cloud.
How to use Splunk software for this use case
- Download the Splunk Observability Cloud Alert Action for Splunk from Splunkbase.
- From the Apps drop-down menu, select Splunk Observability Cloud Alert Action for Splunk, then click on Configuration.
- Enter your Splunk Observability Cloud API token.

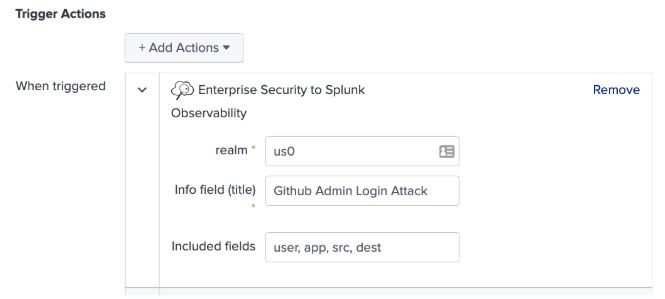
- Create and schedule your alert as normal. Here is an example of the alert setup:

-
At the bottom of your alert setup, click Add New Response Action then choose the Enterprise Security to Splunk Observability response action.

- Input the fields you would like to pass as dimensions into Splunk Observability Events.

- In Splunk Observability Cloud, open the dashboard that you'd like to overlay event data on. In the Event Overlay drop-down, choose an Event Overlay to match your event name. You can use asterisks (*) to work as wildcards.

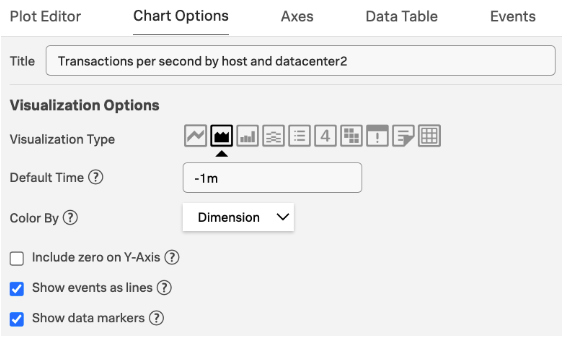
- In your chart options, enable Show events as lines and Show data markers for overlaying events on that chart.

Events will now be overlaid on your chart.

Next steps
These resources might help you understand and implement this guidance:
- Splunk Help: Add information to a dashboard
- Splunk Help: Create and manage organization access tokens using Splunk Observability Cloud

