Reporting on MOVEit transfer activities
MOVEit Transfer supports the exchange of files and data between servers, systems and applications within and between organizations, as well as between groups and individuals using a common shared folder with simple browser access for users. MOVEit Transfer supports the ease of access and secure file transfer that meets or exceeds an organization’s security and compliance requirements.
By ingesting MOVEit Transfer data into Splunk Enterprise, you can access a number of useful dashboards to view reporting on performance and asset overviews in the MOVEit Transfer instance.
Prerequisites
- Splunk Enterprise
- MOVEit Transfer data sources
Support for Splunk Cloud Platform is in the roadmap.
How to use Splunk software for this use case
If you need guidance on building dashboards in Splunk Enterprise, see About dashboards.
The MOVEit App provides a variety of dashboards based on the following key indicators that help MOVEit users have end-to-end visibility about MOVEit Transfer activities.
- Overview
- Node usage for file transfers
- Last used node for file transfers
- File Upload & download status
- File Storage
- File count transferred over time
- Total file size transferred over time
- Users
- User Information
- User details
- User distribution per group
- User status distribution
- User Activity
- All user activities
- Most active users
- Failed user activities
- Success user activities
- User logins
- Most active IP addresses
- Activity by group
- User Information
Based on these key indicators, here is what a sample User Activity dashboard might look like.

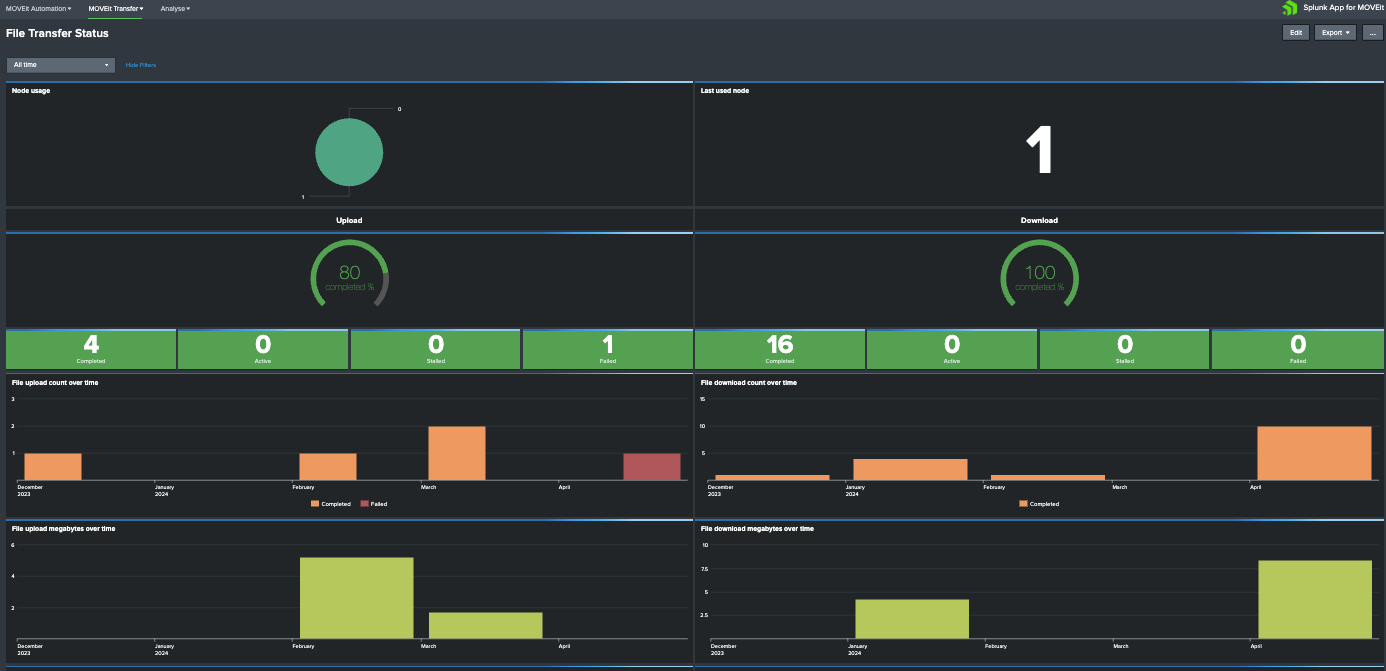
- File Transfer Status
- File upload and download count over time.
- File upload and download megabytes over time
- Largest files uploaded and downloaded
- Most uploaded & downloaded users (by size)
Based on these key indicators, here is what a sample File Transfer Status dashboard might look like.

Next steps
These additional Splunk resources might help you understand and implement these recommendations:
- Product Tip: Following best practices for working with dashboards
- Product Tip: Telling stories with your data using data visualizations
Established in 2000, Bluechip Infotech focuses on delivering the latest IT products to a wide channel base while maintaining a dedicated commitment to first class service. With Australian offices in Sydney, Melbourne, Brisbane, Perth, and Adelaide we’re able to back our commitment to service through localized support. In addition, Bluechip Infotech:
- Has been a Splunk Distributor for 15+ years and an Authorised Learning Partner (ALP) in APAC.
- Has dedicated Splunk Staff and a strong, experienced technical presales team.
- Offers hosted demo environments and partner training vouchers.
Ingeniq, a Bluechip company, is an authorised Splunk training provider. We’ve been working with Splunk to train and enable thousands of customers, partners, and Splunk employees since 2010.The user- and community-generated information, content, data, text, graphics, images, videos, documents and other materials made available on Splunk Lantern is Community Content as provided in the terms and conditions of the Splunk Website Terms of Use, and it should not be implied that Splunk warrants, recommends, endorses or approves of any of the Community Content, nor is Splunk responsible for the availability or accuracy of such. Splunk specifically disclaims any liability and any actions resulting from your use of any information provided on Splunk Lantern.

