Automating Know Your Customer continuous monitoring requirements
Know Your Customer (KYC) standards are used in many financial services industry (FSI) institutions. KYC processes include establishing customer identities, understanding the nature of customers’ activities, validating the legitimacy of customer funds, and assessing customer risk. One of the key parts of that regulation is the requirement to continuously monitor your customers' interactions and transactions. You can use SPL to do this, as shown in this related use case, but you want a more streamlined way to this, preferably using machine learning for better results.
Data required
How to use Splunk software for this use case
In any bank, there are many types of transactions, such as those for core banking, ATM, wire transfers, credit card use, and payments. Every application involved in these activities produces its own time services log data that is used for troubleshooting, security tracking, and analytics. Suppose you are only monitoring a core banking feature for deposits and withdrawals for each customer. The simplest possible representation of this can be given with this example table.
| Timestamp | AccountID | Amount |
|---|---|---|
| 11/2/2022 5:06:30 | 123 | 50 |
| 11/2/2022 5:06:30 | 456 | 6345 |
| 11/2/2022 5:06:30 | 123 | 53 |
| 11/2/2022 5:06:30 | 456 | 4353 |
| 11/14/2022 9:46:30 | 123 | 51 |
| 11/14/2022 9:46:30 | 456 | 6345 |
You can use the SPL stats command to find the average amount per account ID for every entry and then find any account that is more than N standard deviations from the average of the entity itself. However, with the Splunk App for Behavioral Profiling, you can automate this KYC use case as long as you have the data for each functional banking domain.
The Splunk App for Behavior Profiling is no longer being supported, but you can still use it for the steps below to automate profiling an entity by a field.
- Install the app using the instructions available on GitHub, then open the app in the Splunk platform. First, you'll use a little SPL to search for all events for a given source type. The fictitious example below has the data stored in a CSV. Adjust the SPL as needed for your environment and select an appropriate time range.

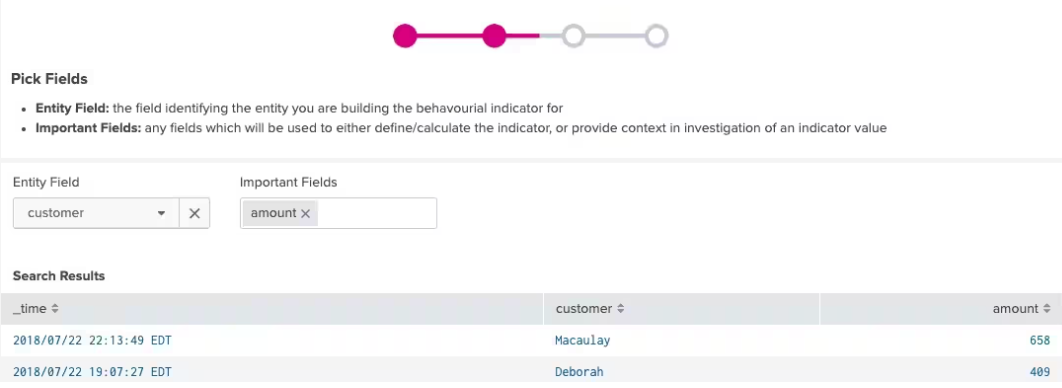
- Pick a field to group by, which in this example is the unique customer name and the amount field, which is the field we will monitor for outliers. The field you monitor might be different, depending on your use case. Sample results for the search and fields in question are shown automatically by the app.

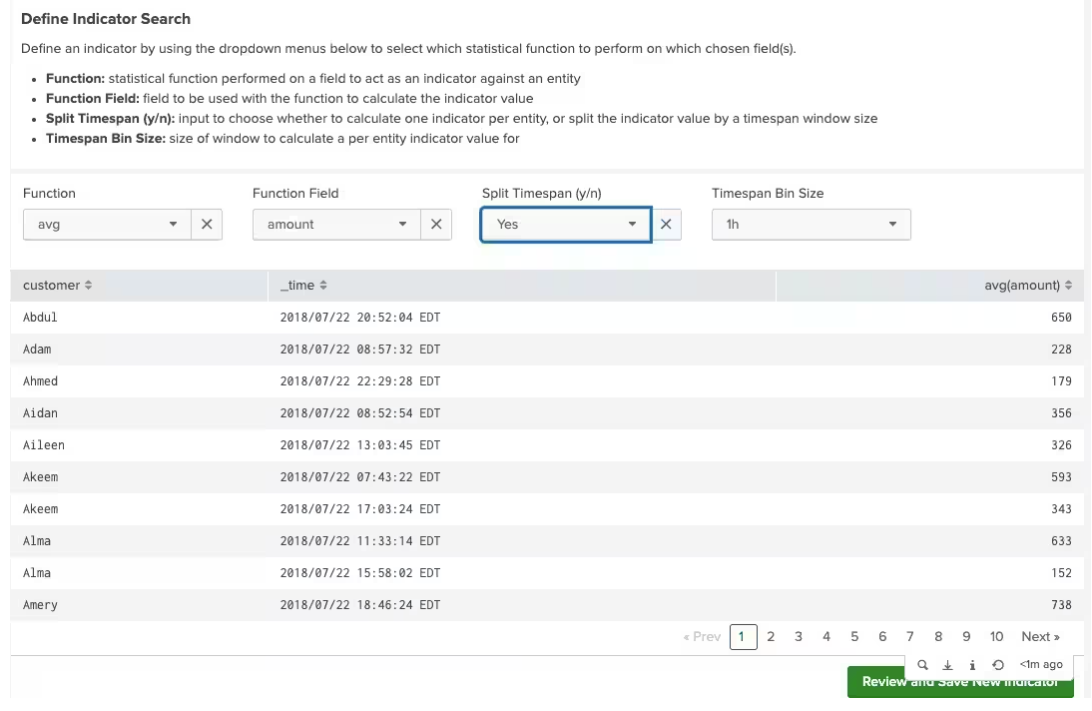
- Next, we pick a statistical function for the amount field (in this case, average) and split it by each unique customer. We can also calculate the average in time span buckets, such as every hour or day.

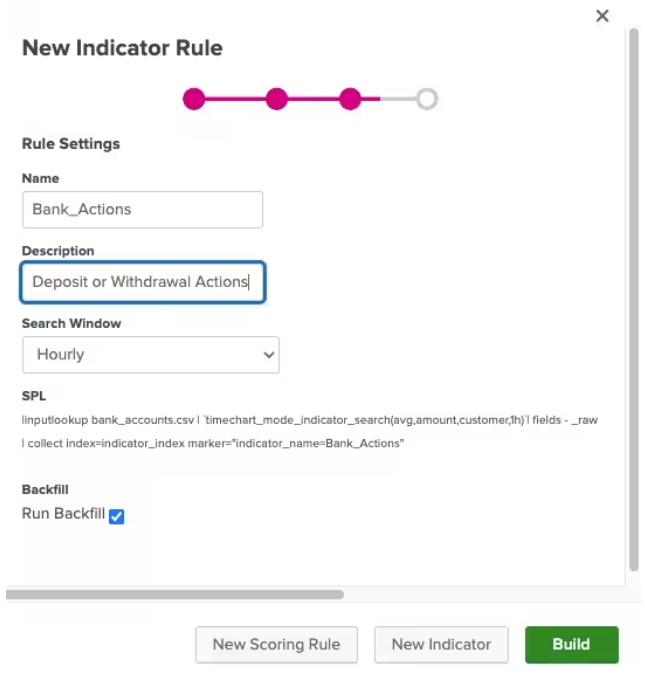
- Finally, save this configuration as a rule to collect the data to find the average amount per customer over a given time period as a scheduled search.

- After the data is automatically collected within a summary index, we can use the app's web interface workflow for the indicators to score for standard deviation outliers, which go to a scoring index to stack rank them.
This automation can be done for each functional domain in the FSI world such as ATM, credit cards, payments, and wire transfers, which makes continuous monitoring an easier task. The app also provides screens to drill down and investigate any particular entity, which is the customer in our case. There is even a review section to mark if an entity’s risk scores have been reviewed, making this useful for compliance checks for review. All of these features make the Splunk App for Behavioral Profiling a useful tool for meeting Know Your Customer requirements.
Machine learning with the Splunk App for Behavioral Profiling
The app also has screens for using machine learning (for example, probability density function) to find outliers within all entities, without having to learn in-depth data science. However, the app isn't intended to use machine learning to find anomalies within the set of transactions for each individual customer. This is because the way machine learning typically works is that it builds a model for a dataset to apply for future data. Building a million models for a million customers is excessive and unmanageable. A more maintainable approach would be to cluster each customer by a segment, such as transaction amounts. Some customers will be clustered as average amounts around 50. Others may be clustered with 500. Some may even be clustered with 500,000 as their typical amounts. Now, you can build a model per cluster and find outliers per cluster rather than for individual customers. This makes the workload scale better.
Next steps
The KYC use case is an important banking regulation and continuous monitoring is the most vital part of it. The Splunk App for Behavior Profiling gives you easier approach to operationalize monitoring each customer’s transactions, and hence their behavior for outliers. The app can be used for a variety of FSI use cases beyond the one demonstrated in this article to look for anomalies within any set of entities or for each entity against themselves.
The content in this use case comes from a previously published blog, one of the thousands of Splunk resources available to help users succeed. These additional Splunk resources might help you understand and implement this specific use case:
- Splunk Lantern Article: Defining and detecting Personally Identifiable Information (PII) in log data
- Splunk Lantern Article: Using modern methods of detecting financial crime
- Splunk Blog: Mind the gap! Understanding end-to-end customer journeys to deliver great customer experience
- Splunk Blog: A Splunk approach to baselines, statistics and likelihoods on big data
- Splunkbase App: Splunk App for Behavioral Profiling

