High-level metrics and a broad fraud overview
Working as part of a fraud detection team, you need to be able to quickly identify when a customer’s account is taken over by a fraudster.
You need to be able to access an overview of potential fraud incidents that you can use as a starting point for further investigation. This process walks you through how to use and work with such a dashboard.
Required data
Procedure
The information in this article applies to Splunk Enterprise Security (ES) versions 7.x. If you have upgraded to Splunk Enterprise Security version 8.x, some terminology and steps might not apply. For additional assistance on this use case with ES 8.x, Splunk Professional Services can help.
- Install and configure the Splunk App for Fraud Analytics, following the installation instructions.
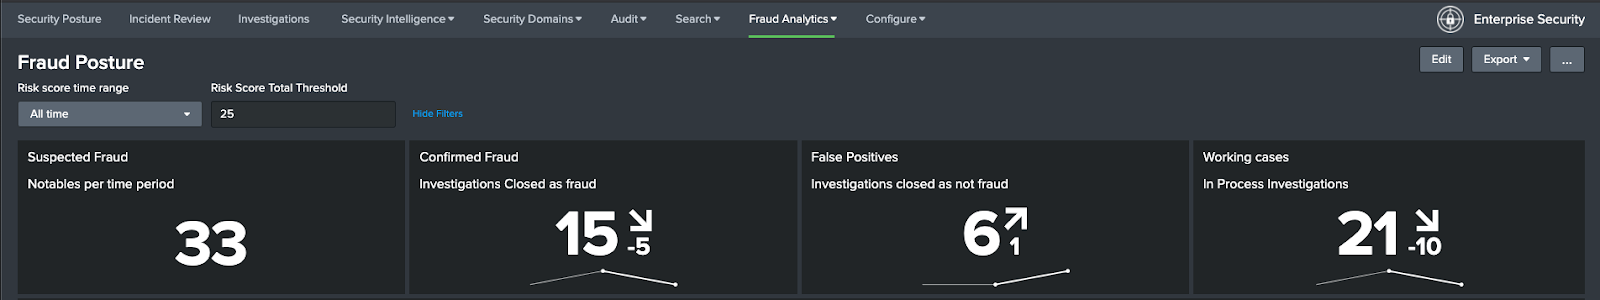
- Under the Fraud Analytics tab in the top toolbar of Splunk Enterprise Security, click Business View, then Fraud Posture to open the Fraud Posture dashboard.
- Check the metrics there. In the example below, starting with the top row of metrics, there are 33 Notables (or alerts) that have been generated, while Confirmed Fraud and False positives are both trending up, and investigations are trending down.
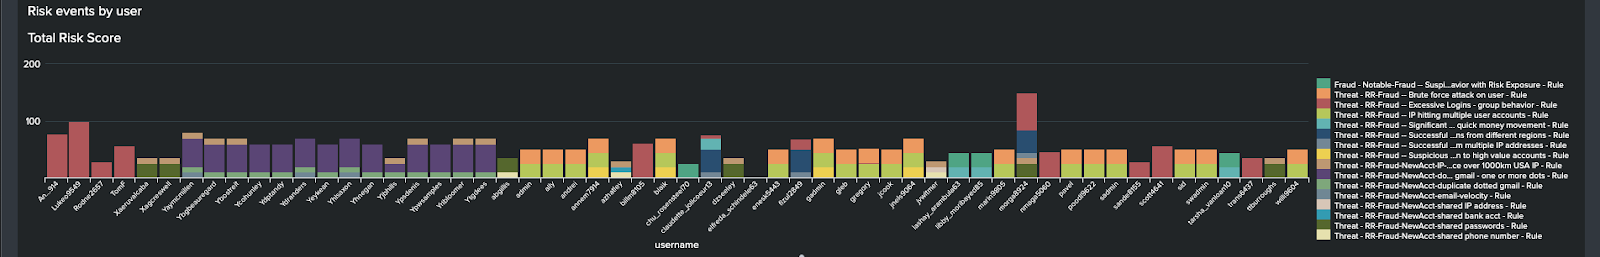
- The bar graph in the middle shows Risk Events by user. The threshold for this is set using the Risk Score Total Threshold at the top of the dashboard. You can hover over a user or rule for more information.
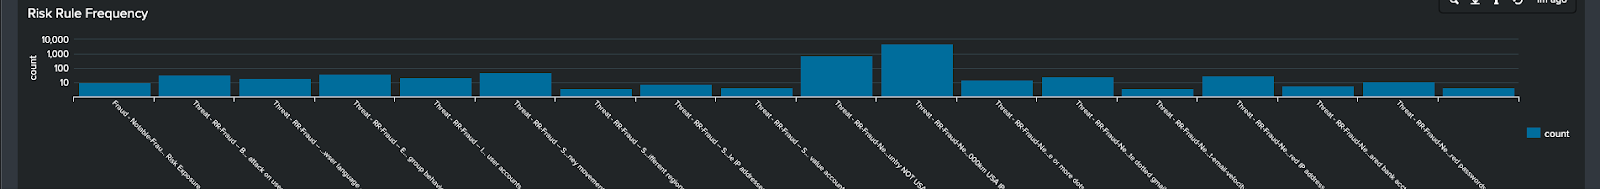
- At the bottom of the screen you can see Risk Rule frequency, which displays how often each Risk Rule (Risk Incident Rule) has been triggered. This might give you some insight to any tuning that needs to be done if a rule fires too much or too little.
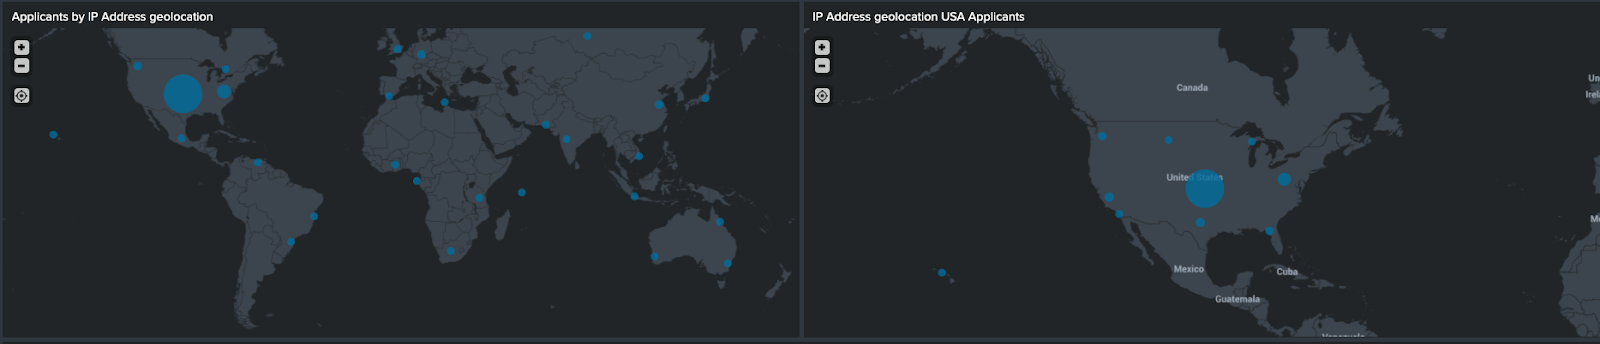
- Move down the page to see IP Geolocation maps, as shown in the example below. These allow you to get an idea of where people are applying for new accounts from. Some spikes in certain areas could indicate a fraud ring, for example, spikes in locations where there have been no marketing campaigns taking place.
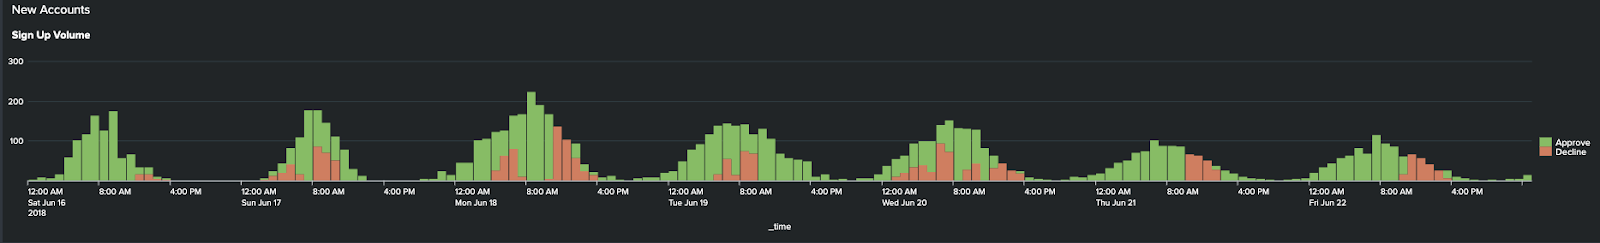
- Further down the page you can see New Account Sign Up Volume. Volume that doesn’t follow an expected curve or has a high decline rate could indicate a system issue, or a fraud issue.
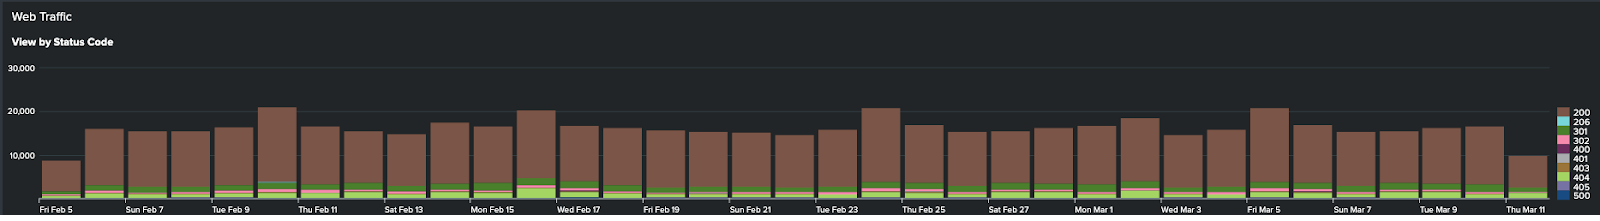
- You can also see Web Traffic, since increased traffic with error messages (such as 404, 500, 503) could also be indicative of fraud.
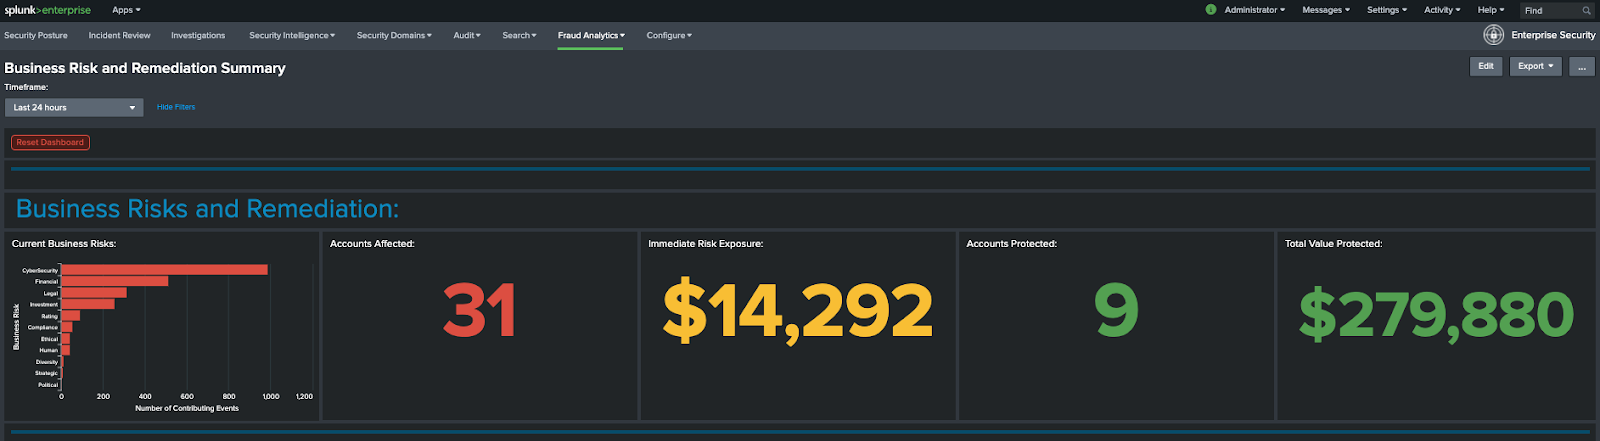
- Going back to the Fraud Analytics tab in the top toolbar of Splunk Enterprise Security, click Business Risk and Remediation Summary to access a different view of this data. In the example below, the 31 accounts shown are directly related to the 35 notables from the Fraud Posture dashboard. There are also dollar amounts tied to the closed and open Notables.
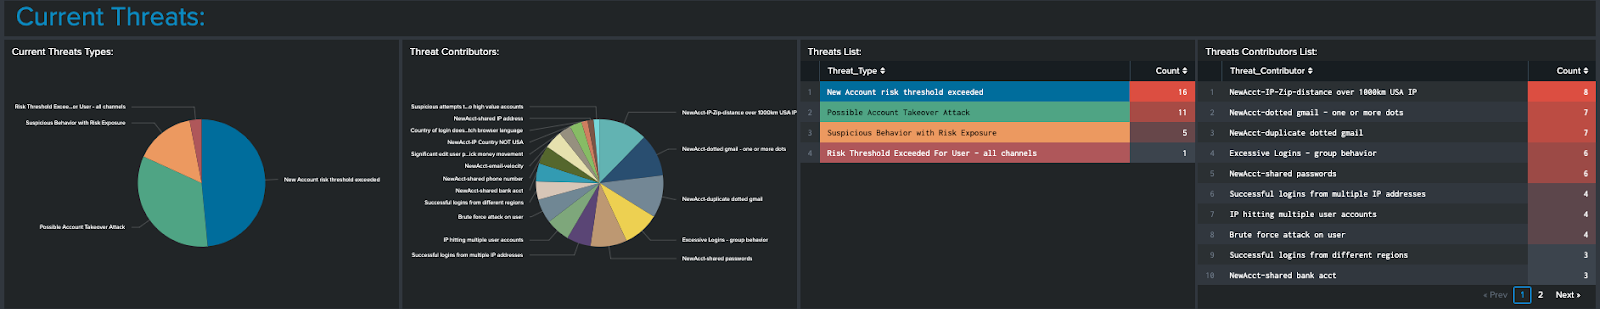
- Further down the screen, you can see that since accounts and events have been tagged with risk descriptors, categories of risk can be identified for these events. The pie graphs and tables are different views of the Risk Incident Rules and Notables that were seen in the Fraud Posture dashboard, allowing you to visually tie the top metrics to the correlation searches.
- Navigate to the Incident Review tab in the top toolbar of Splunk Enterprise Security. Filter on Fraud under Security Domain to view Fraud Notables, as shown in the example below.
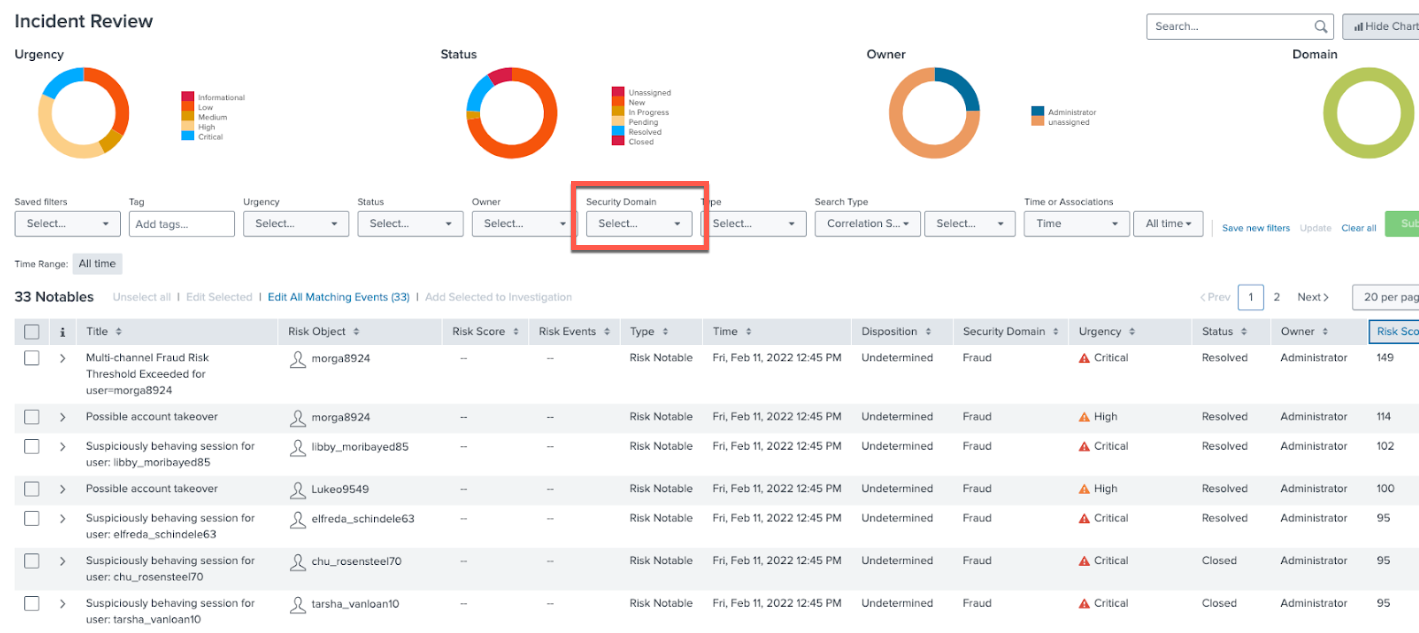
- Sort by Risk Score Total or Urgency as required.
It's important to note that Risk Score Total and Urgency are not the same. High Risk Score totals can be achieved via lots of small scores and may indicate fraud. High or Critical Urgency notables can exist with lower risk scores, indicating that the combination of events that create the notable is very risky but may not add up to a high Risk Score.
This example shows a risk based alerting (RBA) model, with many noisy alerts written to the risk index. The total score for a user, or some combination of events triggers the notable. Your aim should be to drive down false positives and reduce alert fatigue.
Next steps
Now that you've completed this one, have a look at the other tutorials in the Detecting consumer bank account takeovers use case. In addition, this resource might help you understand and implement this guidance: