Reporting on MOVEit automation activities
MOVEit Automation provides a simple but powerful user interface for defining business workflows that anyone on your IT team can use. With MOVEit Automation you can automate tasks like pushing and pulling files to/from any FTP server based on events or schedule, manipulating/transforming file content, managing files for transfer, storage or deletion.
By ingesting MOVEit Automation data into Splunk Enterprise, you can access dashboards to view performance information and asset overviews in the MOVEit Automation instance.
Prerequisites
- Splunk Enterprise
- MOVEit Automation data sources
Support for Splunk Cloud Platform is in the roadmap.
How to use Splunk software for this use case
If you need guidance on building dashboards in Splunk Enterprise, see About dashboards.
The MOVEit App provides a variety of dashboards based on the following key indicators that help MOVEit users have end-to-end visibility about MOVEit Automation activities.
Overview of assets
- Tasks
- Total tasks
- Enabled tasks
- Disabled tasks
- Unscheduled tasks
- Incomplete tasks
- Hosts
- Total hosts
- Assigned hosts
- Unassigned hosts
- Keys
- Expired/About to expire
- PGP keys
- SSH keys
- SSL certs
Based on these key indicators, here is what a sample Overview dashboard might look like.

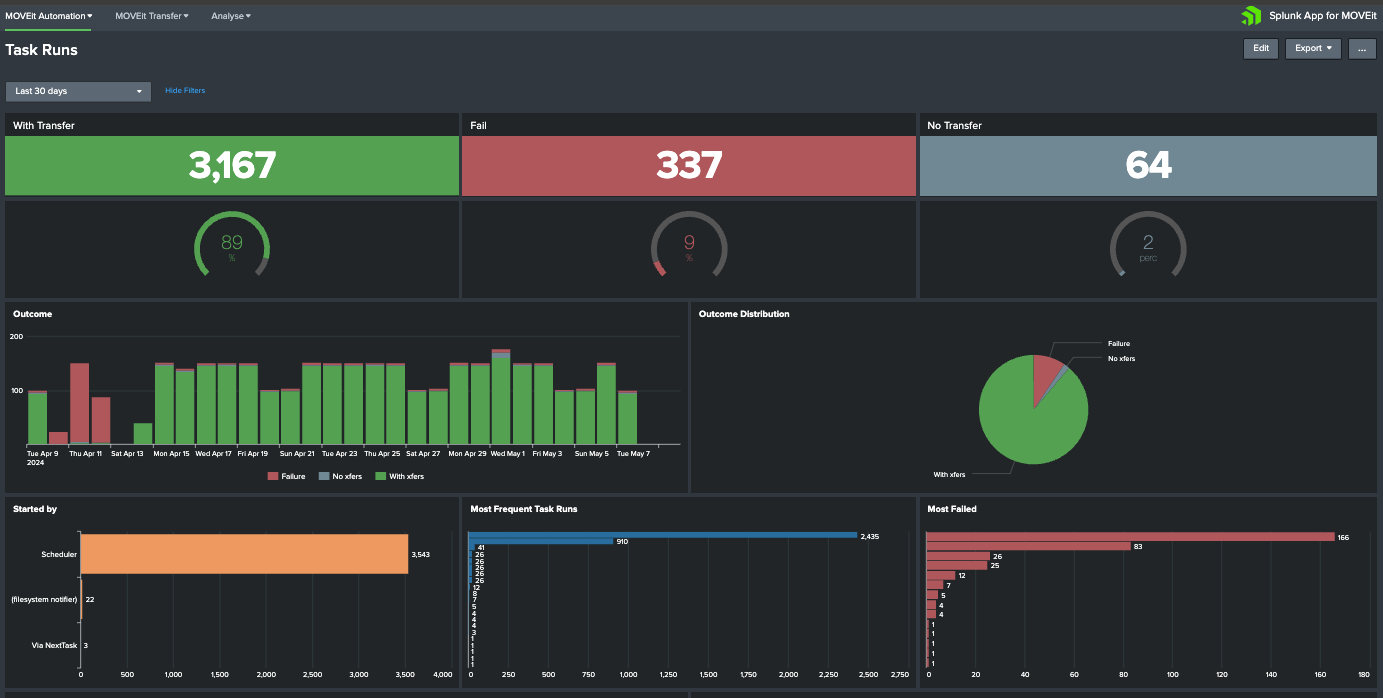
Task runs

- Count of task runs
- Successful with/without file transfer
- Failed
- File activities

- Count of file activities
- Successful
- Failed
Based on these key indicators, here is what a sample Task Runs dashboard might look like.

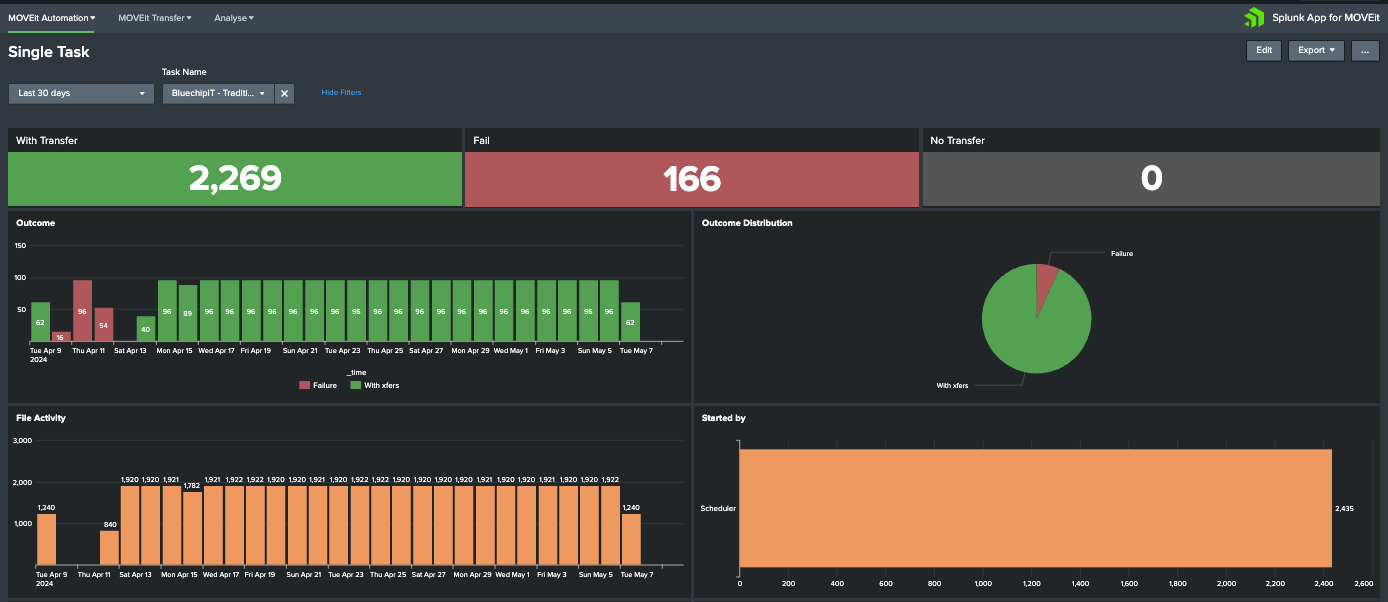
If you select a specific task from Task Runs dashboard, you will be directed to a single-task dashboard that includes the following information about the task:
- Task Name, Task ID
- Status – color coded (With Transfers - green, Failures- red, No Transfers- grey)
- Status code (resultant code of the task run)
- Started by (Scheduled or if a user, with the users name)
- Node
- Duration (in Seconds), Total Bytes sent, Files sent
- Run ID (Unique incremental ID for each run)
- Start time, End time
Here is what a sample Single Task dashboard might look like.

Next steps
These additional Splunk resources might help you understand and implement these recommendations:
- Product Tip: Following best practices for working with dashboards
- Product Tip: Telling stories with your data using data visualizations
Established in 2000, Bluechip Infotech focuses on delivering the latest IT products to a wide channel base while maintaining a dedicated commitment to first class service. With Australian offices in Sydney, Melbourne, Brisbane, Perth, and Adelaide we’re able to back our commitment to service through localized support. In addition, Bluechip Infotech:
- Has been a Splunk Distributor for 15+ years and an Authorised Learning Partner (ALP) in APAC.
- Has dedicated Splunk Staff and a strong, experienced technical presales team.
- Offers hosted demo environments and partner training vouchers.
Ingeniq, a Bluechip company, is an authorised Splunk training provider. We’ve been working with Splunk to train and enable thousands of customers, partners, and Splunk employees since 2010.
The user- and community-generated information, content, data, text, graphics, images, videos, documents and other materials made available on Splunk Lantern is Community Content as provided in the terms and conditions of the Splunk Website Terms of Use, and it should not be implied that Splunk warrants, recommends, endorses or approves of any of the Community Content, nor is Splunk responsible for the availability or accuracy of such. Splunk specifically disclaims any liability and any actions resulting from your use of any information provided on Splunk Lantern.

