Using modern methods of detecting financial crime
Financial crime is a superset of fraud that includes fraud, account abuse, money laundering, embezzlement, sanctions violations, and a host of other crimes. Each of these by itself may not be obvious fraud, but collectively they lead to the general category of financial crime. Your company wants to improve its financial crime detection capabilities, so you need incremental steps for achieving better detection posture.
Prerequisites
-
Splunk Enterprise version 9.x.x+ or higher / Splunk Cloud Platform version 9.xx + or higher
- Splunk AI Toolkit
- Python for Scientific Computing
Data required
How to use Splunk software for this use case
With Splunk software you can ingest machine generated data into a system that indexes all data in real-time and analyze the data using your rules. Doing so allows you to create reports for trending, anomalies, and pattern detection. Furthermore, since it’s impossible for humans to continuously watch dashboards, you can schedule searches in your Splunk deployment and have them deliver results as actionable alerts.
This article shows you:
- A general process for using Splunk software to detect financial crime
- Creating risk scores with a basic approach using join or append
- Creating risk scores with a different approach, saving fraud detection search results into a risk index
- Detecting anomalies with the Smart Outlier Detection Assistant
- How to improve your risk-based alerting strategy using Splunk Enterprise Security
- How to find the leader of a fraud ring
The general process
- Understand your use cases. Begin with two basic questions: what problems do you see, and who does it matter to if the problems are solved? Then, when you create a list of use cases, you can enumerate them, categorize them, and prioritize them.
- Define your rules. Every business has its own set of rules for thresholds and possibly even secret algorithms to monitor behavior. Independent of product choice, spend some time defining rules for what constitutes fraud. You might start with your own knowledge of the business and then move onto your industry’s best practices that could be found through online reference or outside consultants.
- Define the data behind the rules. Rules are algorithms, but they do nothing without data. You need to know where data comes from and whether it can be accessed via computer systems to be processed in rules. Transaction logs, either buried in log files or hidden in databases, are a good start. You’ll also want to enrich the data with more meaning to make it easier to understand. For instance, if data says account number xxxx-9999 purchased this item in city X for Y dollars, then you may want to have your system enrich this data at search time with user names, home address, and phone number to provide some context, both for geographic patterns and for contacting the user directly from the event data. The enriched data may come from a database or configuration management database.
- Ingest the data and then search, report, and alert on it. The next few sections in this article discuss some specific ways to do so.
Combine your rules with AND (which is the implied Boolean operator) and use WHERE clauses to filter out exceptions and thresholds. More complex searches can help differentiate rules and reduce alerts that fire on unimportant issues. With fewer alerts, you can triage and respond faster.
Working with risk scores
Any one notable event rule might not be nefarious, but the sum of the scores for all rules leads to a total score that gives confidence that the user, customer, account ID, institution, or entity has been compromised. This accumulated value of all the risk scores can enhance an analyst's ability to triage events so that a single issue does not create a bunch of false positives to investigate. It also allows the analysts to work on the highest scoring indicators first for a use case.
To implement this approach, add a weighted risk score to each rule. Then, turn each rule into a saved search in the Splunk platform that can be executed all at once in order to return a single, user-defined risk score per search that can be multiplied by a weight for importance. The grouping of all rules can be done by username, customer, account ID, institution, or whatever entity is a common way to identify the account.
A basic approach - Using join or append
Here is an example SPL query you can use:
index=transactions
|fields username
| dedup username
| join type=left username
 [savedsearch RiskScore_ConnectionFromRiskyCountry]
| join type=left username
 [savedsearch RiskScore_ExcessiveLogins]
| join type=left username
 [savedsearch RiskScore_AccountPasswordChange]
| eval RiskScore_ConnectionFromRiskyCountry=RiskScore_ConnectionFromRiskyCountry*0.75
| eval RiskScore_ExcessiveLogins=RiskScore_ExcessiveLogins*1.5
| eval RiskScore_AccuntPasswordChange=RiskScore_AccountPasswordChange*.90
| eval Total_Risk=RiskScore_ConnectionFromRiskyCountry+RiskScore_AccuntPasswordChange+RiskScore_AccountPasswordChange
 | table Username, Total_Risk
- Use
fillnullto put 0 into risk scores, if nothing returns. - Use lookups to avoid hard coded weights.
- Use machine learning to update weights.
Tweak this approach as needed and architect it properly for your use case domain. Some ways you can implement performance improvements with this approach include:
- Rather than using a left outer join to do the grouping, you can use a series of appends to concatenate the results of the saved searches, and then use the
statscommand to group by username. This can lead to performance improvement. - Use summary indexes for a summary that is going to be looked back in time (for example, in money laundering use cases) or to use data models and data model acceleration for faster retrieval of data.
- Have each saved search run on a scattered schedule (not all at once, but with gaps of a few minutes in between them) because account takeover is not a near real-time event until it happens. You can store the risk score for each username in a new summary risk index using the collect command. The Splunk platform can then run another scheduled search that uses an N-minute window with the streamstats command to group all risk scores by username from the risk index and fire an alert if the score is above a threshold.
The problem with this approach is that increasing amounts of data and rules might tax the system. Any saved search that calls multiple other searches at the same time on a schedule is going to result in intense CPU activity.
We encourage other solutions to this problem that do not use join or subsearches to maximize scalability.
A different approach - Saving fraud detection search results into a risk index
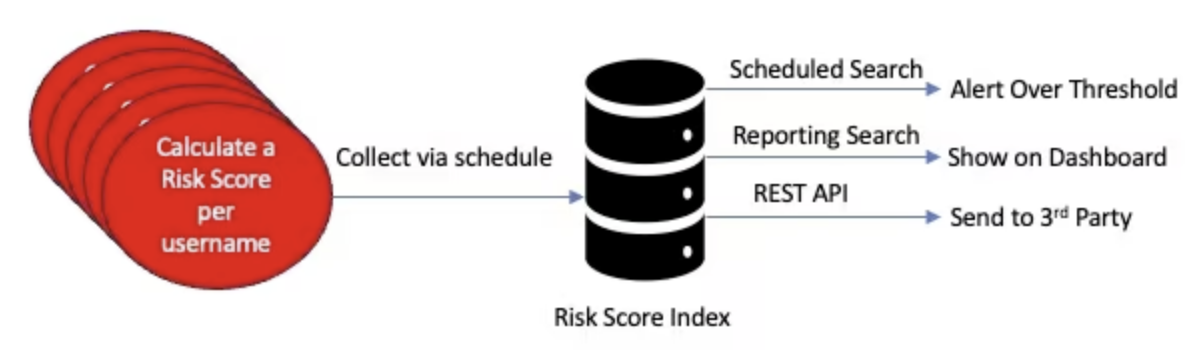
A more efficient way to work with risk scores is to run each saved search separately on a staggered schedule, save the results to a risk index, and then, when needed, perform the aggregation per user to get to the same result. The risk index can then store more context such as a timestamp, amount transferred, recipient, location, etc. This is more in tune with the way Splunk Enterprise Security works with risk-based alerting (RBA). After storing the data in a separate risk index, it can be aggregated per entity (customer, username, account ID) to send as an alert, if the total risk score is over a threshold, show on a dashboard, or send the results to a third party system for further analysis. The picture below summarizes this approach.
Collect risk scores per rule per username
Your first step is to schedule a saved search that collects results for any particular rule, including a risk score per fraud rule for the user. For example:
| savedsearch RiskScore_ConnectionFromRiskyCountry
| collect index=risk addinfo=false sourcetype+riskscores
Here, the collect command adds the results of the saved search to a risk index, which in this case is searching for all users who have connected from a risky country. Optionally, the addinfo parameter is set to false to avoid collecting some Splunk metadata, which you might not use. The risk index is a Splunk summary index.
Here is an example of what the data might look like in this summary index (with only some relevant fields shown):
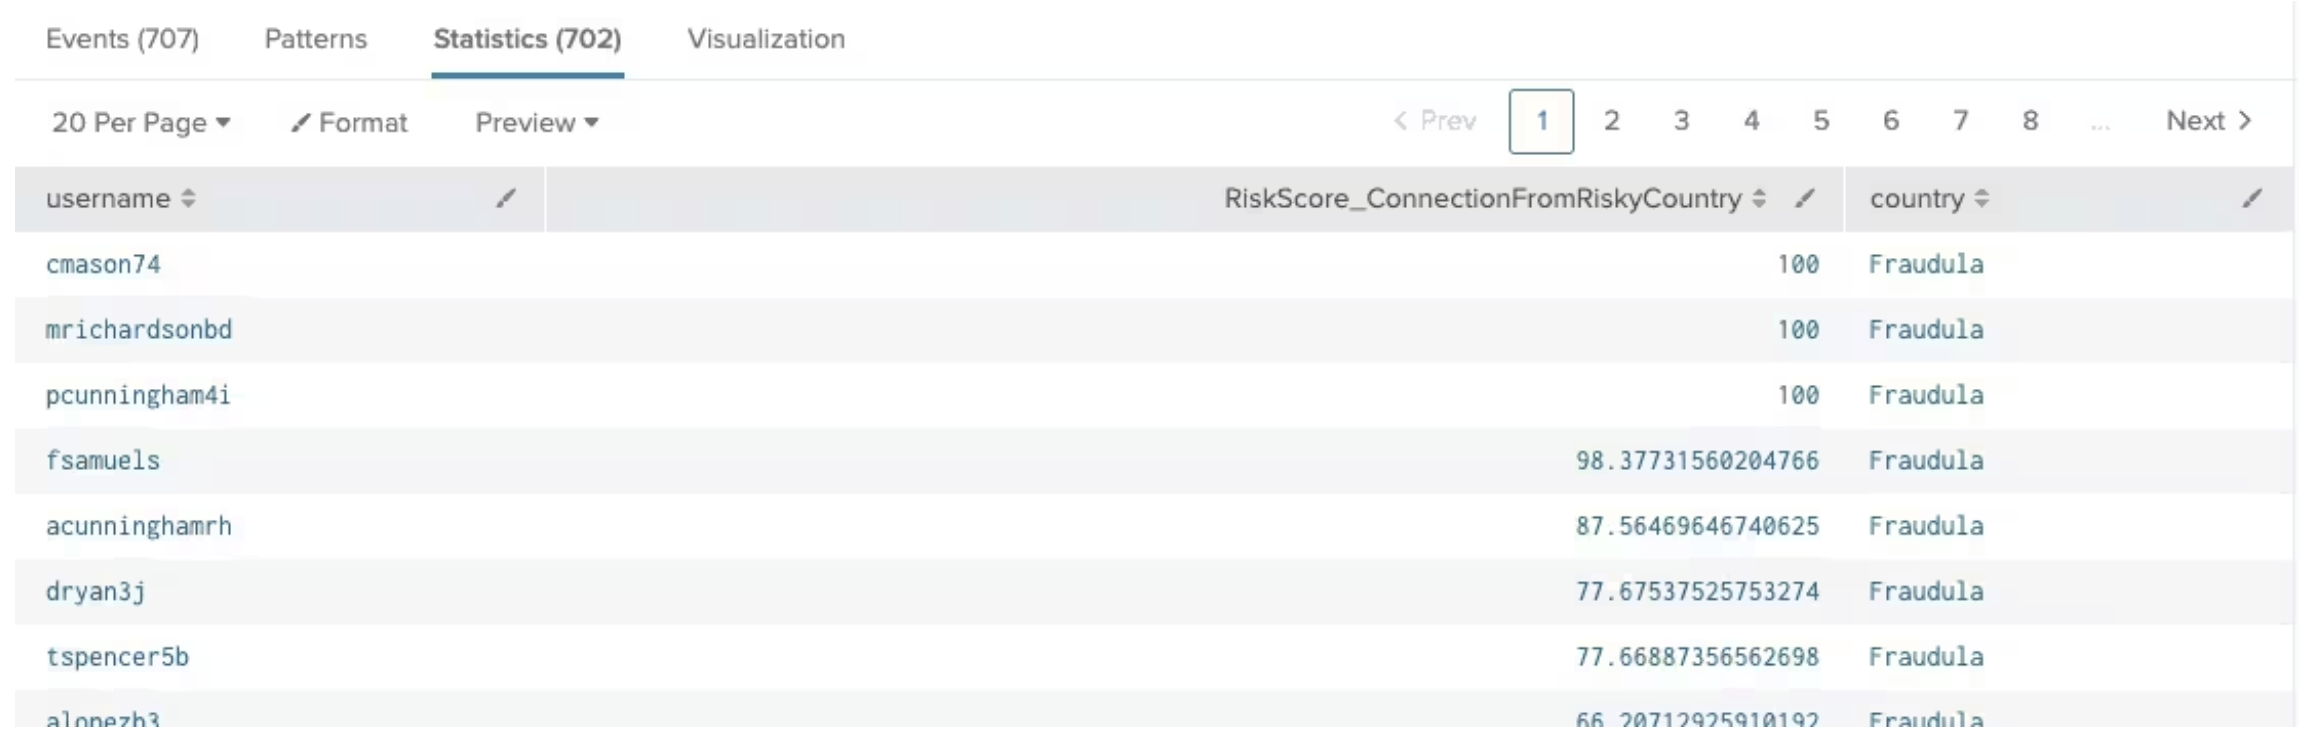
For each rule that computes a risk score, the risk score, username and context can be placed into the risk index. You should avoid storing risk scores that are 0 as they do not contribute to the overall risk. For convenience, all risk scores start with the prefix RiskScore.
Aggregating results
Now that you have collected the data, you need to aggregate the results per user. Here’s one way to do it using the stats command, which scales well.
index=risk
| fields_raw host date* sourcetype source index linecount splunk_server stats values (*) AS Risk * BY username, time

The risk scores in this particular example risk index do not start with RiskScore, so you can put Risk_ as a prefix for all risk scores. This is good to show in a report, but what you really need is the total risk score per user as that can then be compared with a threshold for alerting when a user is definitely a risk to commit financial crime, when they have exceeded a threshold.
index=risk
| fields_raw host date* sourcetype source index linecount splunk_server stats values (*) AS Risk_* BY username, _time
| eval TotalRiskScore Risk_AML_AccountCollusion+Risk Account PasswordChange+Risk_AccountTenure+Risk_Accountholder_Age +Risk AddressChange+Risk ConnectionFromRisky Country+Risk ExcessiveLogins+Risk_ExcessiveTransactions +Risk MultipleDeviceConnections+Risk_MultipleUsernameLogins fromSingleIP+Risk_NewBeneficiaryDestinationCountry +Risk POBoxAddresses+Risk Sanctioned Payment Destination+Risk TransactionsOutliers+Risk_UsernameLoginMultipleIps +Risk VelocityConnections Itable username _time TotalRiskScore Risk*
| sort - TotalRiskScore
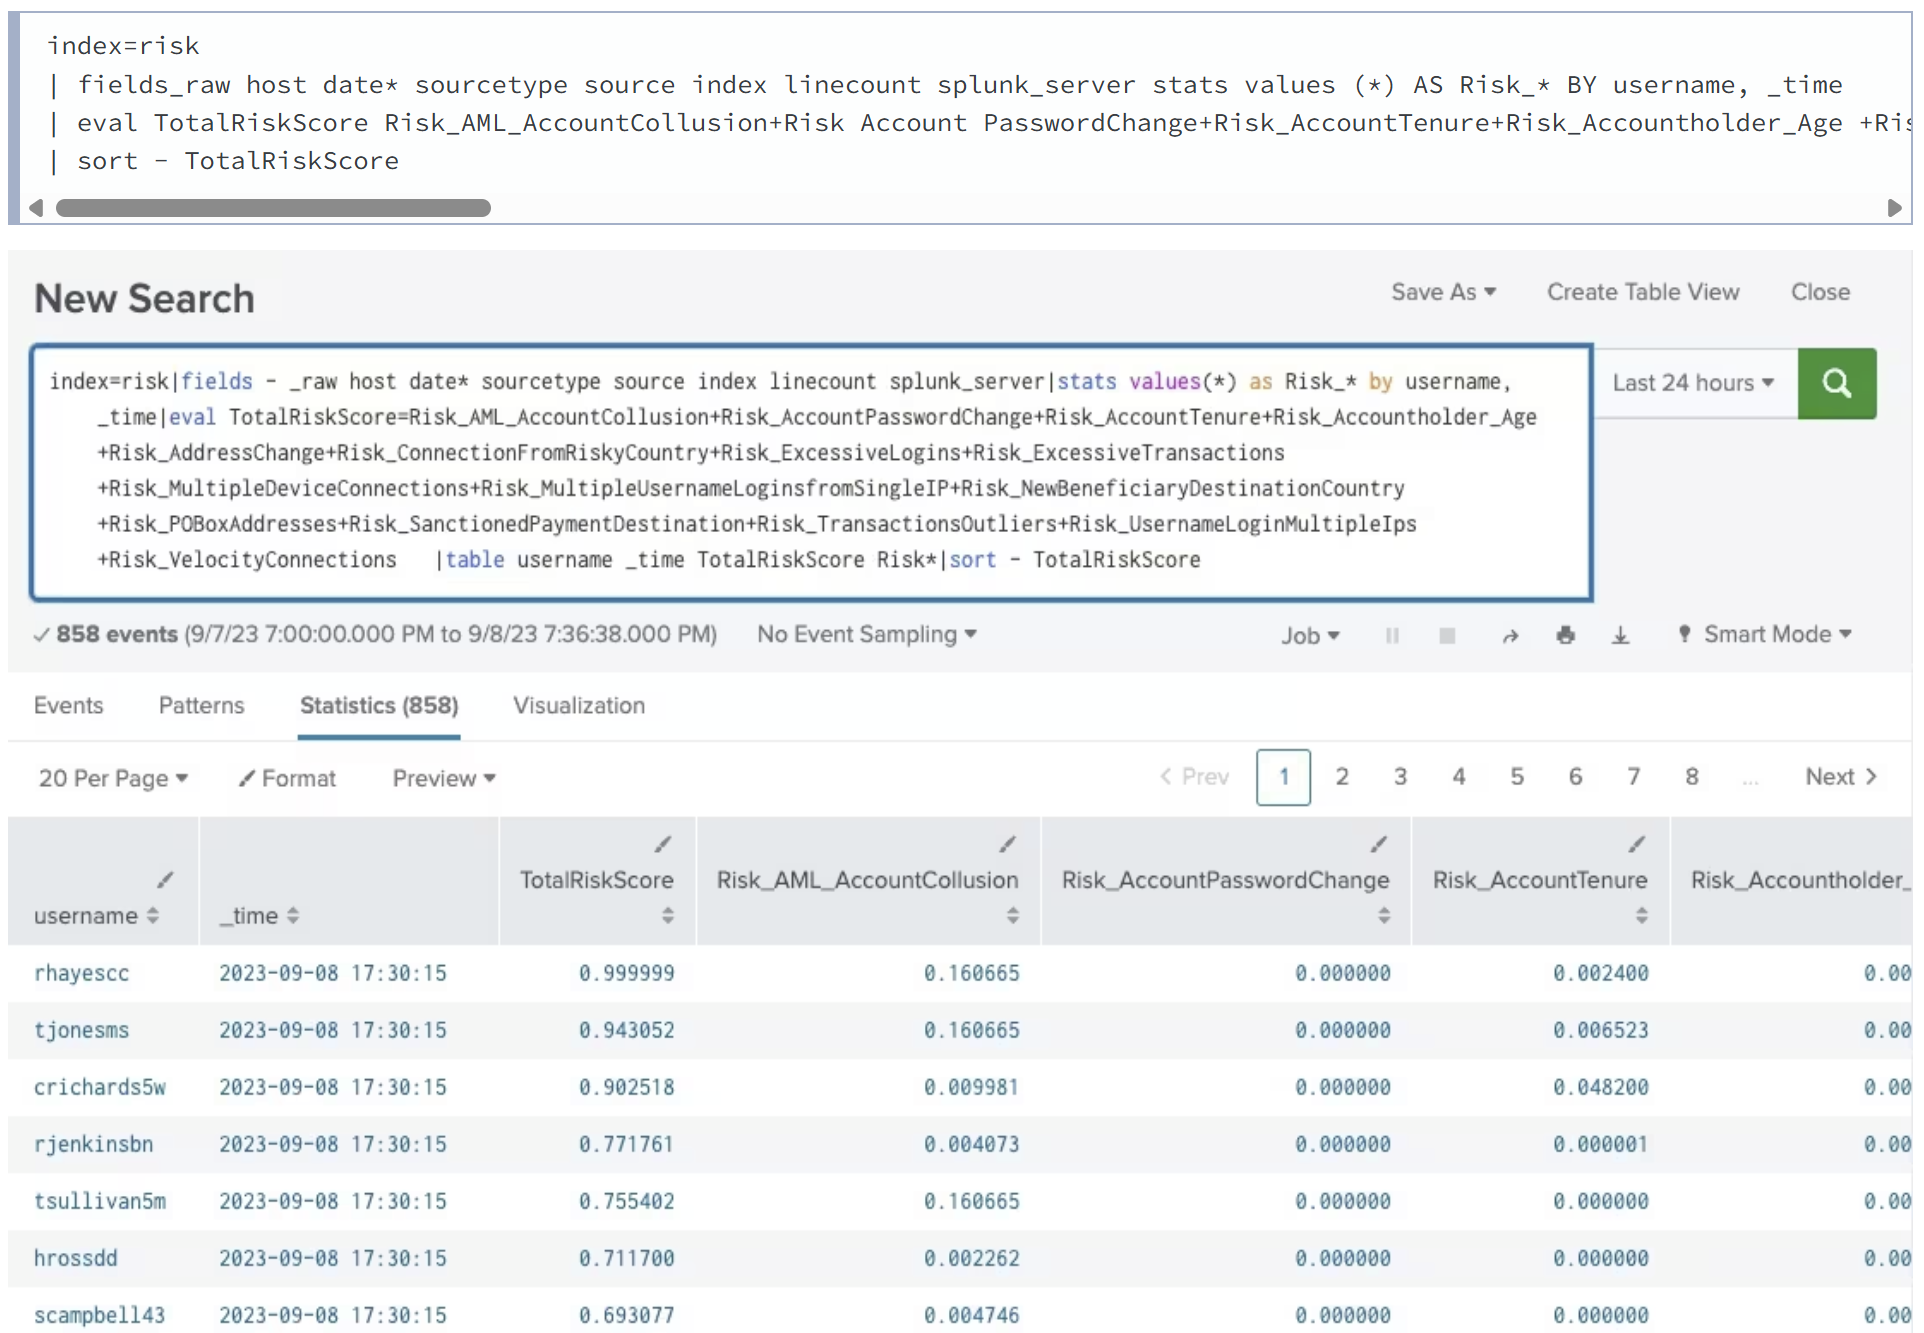
This example adds up all possible risk scores per username and puts them into a TotalRiskScore variable. You can run this on a frequency of your choosing, for example every 20 minutes with a look back of a few hours to a few days, depending on what type of fraud is being investigated. The TotalRiskScore can be compared to a threshold and alerted upon.
If the requirement is not to immediately alert upon the summation of each risk score per user, but to store the summation in another risk index, that can be done as well. Here’s what that would look like:
| stats sum(RiskScore_Account PasswordChange) AS Account PasswordChange sum(RiskScore_AddressChange) AS AddressChange sum(RiskScore_ConnectionFromRiskyCountry) AS ConnectionFromRiskyCountry sum(RiskScore_ExcessiveLogins) AS ExcessiveLogins sum(RiskScore ExcessiveTransactions) AS ExcessiveTransactions sum(RiskScore_MultipleDevices) AS MultipleDeviceConnections sum(RiskScore_MultipleUsernameLogins fromSingleIP) AS MultipleUsernameLoginsfromSingleIP sum(RiskScore_NewBeneficiaryDestinationCountry) AS NewBeneficiaryDestinationCountry sum(RiskScore_POBoxAddresses) AS POBoxAddresses sum(RiskScore_Sanctioned Payment Destination) AS SanctionedPayment Destination sum(RiskScore_TransactionsOutliers) AS TransactionsOutliers sum(RiskScore_UsernameLoginMultipleIps) AS UsernameLoginMultipleIps sum(RiskScore_VelocityConnections) AS VelocityConnections sum(RiskScore_Account holder_Age) AS Accountholder_Age sum(RiskScore_AccountTenure) AS Account Tenure sum(RiskScore_Money Laundering_AccountCollusion) AS AML_AccountCollusion BY username
| eval Threshold = 0.580275 collect index-risk addinfo=false sourcetype=riskscores

Either way, the aggregate risk scores are now available per user name and ready to compare to a threshold.
You might also want the data to be sent periodically to a third party, by having the third party call the Splunk REST API to search for the data and process it. An example of why this might be useful is if a piece of third party software created a simple technique to use AI against risk scores to do deep analysis with the data. This could be used to predict future risk scores per user, find subtle outliers per risk score grouping, cluster risk score types, find out which risk scores contribute most to fraud, or examine which risk score aggregations get near the threshold but never exceed it. While all of these ideas can be tried out in the Splunk Machine Learning Tool Kit (Splunk MLTK), this is an open system and if there are more advanced AI tools out there, yet to be invented for deeper analysis, they could be employed in the future.
In either case, Splunk Enterprise or Splunk Cloud Platform have done the heavy lifting to gather unstructured data, index it, create a schema on the fly, further summarize the data with fraud rules and associated risk scores, and finally aggregate the risk scores to look for fraud. Any use case beyond that is welcomed.
Using data models
As the approach here is about scale, you could use a Spunk Data Model on top of the summary index data where the username and associated risk score would be the primary fields. Other fields could still be in the raw data, but these two fields are the main drivers to find fraud per user. In this manner, data model acceleration could be used to speed up access and the tstats command could be used for aggregation. If the amount of risk score events being searched is in the many millions, a data model should be considered. However, if you are only aggregating a few million events every hour, the stats command should be fine.
In an extreme case where an individual search rule itself involves millions of events in a short time period, consider creating an accelerated data model for that source type to scale the search.
Detecting anomalies with the Smart Outlier Detection Assistant
Even if you are not familiar with the Splunk AI Toolkit or machine learning in general, Splunk offers the Smart Outlier Detection Assistant to help you find anomalies or outliers in your data, including risk scores. This guided workflow simplifies the process of applying machine learning functions to identify unusual patterns.
The Smart Outlier Detection Assistant allows you to easily specify your risk score field name, and it guides you through applying appropriate machine learning functions to discover outliers.
In this example, we will detect outliers in Bitcoin Transactions. Using a limited sample dataset, this is what it looks like to find anomalies for users sending, users receiving, and the value:
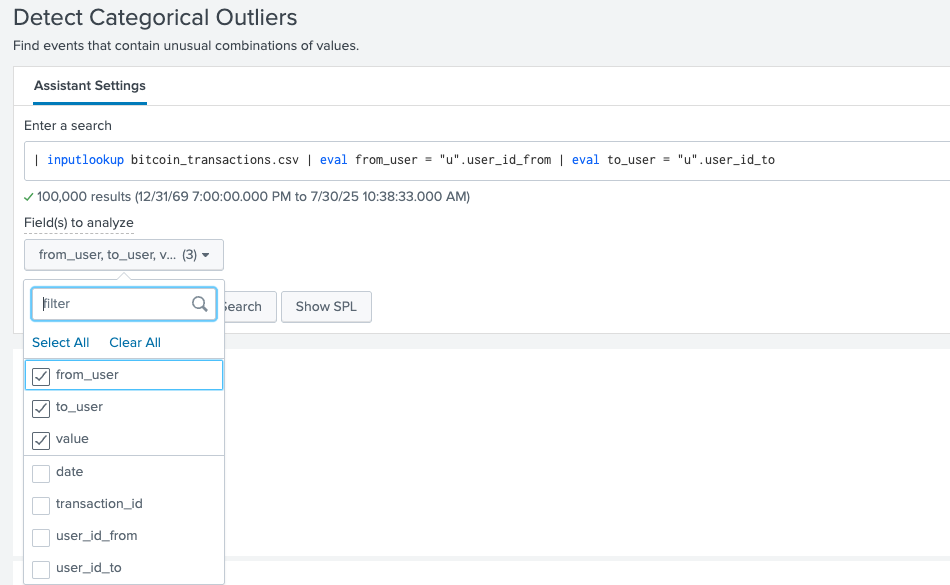
This is what it looks like to find anomalies for all the transactions using the assistant:

You can utilize the Smart Outlier Detection Assistant for a user-friendly and effective preliminary check against your data. For any type of further, more advanced or customized machine learning analysis for anomaly detection, continue to leverage the full capabilities of the Splunk MLTK app.
Risk-based alerting
Although the ideas above are better than using singular rules, you can improve your process even further. What if there was a framework that does what was described above, but also handles:
- Case management
- Sequencing of events
- Management of alerts
- Context of what the user did (not just the Risk Score, but other important information such what country was used in the wire transfer and the amount)
- Mapping of rules to security frameworks such as MITRE ATT&CK and Cyber Kill Chain
- Serving as a platform for collecting notable events
This is called risk-based alerting (RBA) in Splunk Enterprise Security, which is the next level of sophistication in detecting financial crime. RBA ships out of the box with Splunk Enterprise Security and all these features come with it. What this does is collect notable events within a risk index, apply some meta-data context, and allow for alerts when alert thresholds are met. The alerts themselves can be sent to a SOAR product such as Splunk SOAR to create automated playbooks to respond to the situation. A response could be to block the inbound IP, lock out the account, notify the account holder, and notify all involved company parties to analyze the case.
To understand RBA, refer to these articles:
- Implementing risk-based alerting
- Investigating interesting behavior patterns with risk-based alerting
Splunkbase also has a free app called Splunk App for Fraud Analytics, which comes with out of the box use cases with data models, searches, and risk scores leveraging RBA. The advantage of using this app is that it does most of the initial setup and plumbing for the approach that has been described in the sections above because RBA is built into Splunk Enterprise Security. Account takeover and account abuse are two such use cases a Splunk Enterprise Security user can leverage right away.
Finding the leader of a fraud ring
Since account takeover and money laundering have been mentioned a few times now, the next question is how to discover who the leader of a fraud ring is. The stats command in the Splunk platform can help you find out who conducts the most transactions to the most number of accounts in a time period.
|stats sum(amount) AS amount count BY From_Account, To_Account
|sort - count
This looks easy, but it does not give us a graph where A connects to B and B connects to C and so forth. Also, a number for connections might miss many edge cases when there are a million accounts and a few million transactions involved.
You can use directed graphs to find possible connections between accounts or users using a technique called eigenvector centrality to find the most connected nodes that might lead to fraud ring leaders. This is highlighted in this picture below with the large dot in the bottom center of the picture.
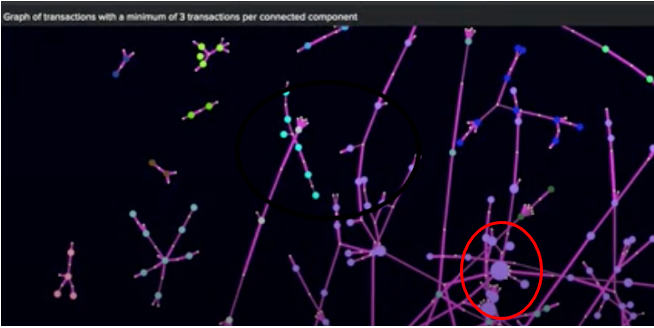
The search can still be used to find from and to accounts grouped by sender and receiver, but the graph is what does the work. It uses an app called 3D Network Topology Visualization that can be freely downloaded from Splunkbase to implement the use case. For more information on how this is done for fraud ring detection, download the free e-book Bringing the Future Forward and read the chapter on detecting financial crime using network topology graphs (written by Splunk Principal Architect Philipp Drieger).
Next steps
The advantages of using any time series data at scale and quickly pivoting with rules, risk scores, and risk-based alerting should be a welcome addition to any organization’s financial crime detection posture, regardless of industry.
In addition, the Splunk Essentials for the Financial Services Industry app helps you automate the searches to detect financial crime. The app also provides more insight on how searches can be applied in your environment, how they work, the difficulty level, and what data can be valuable to run them successfully. You might be interested in:
Finally, the Splunk App for Fraud Analytics provides a number of other fraud detection solutions for financial services such as account takeover and new account abuse.