Detecting Operational Technology assets communicating with external systems
For decades, the teams in charge of securing industrial control systems lived with a false sense of security. Firewalls and the infrequency of attacks on operational technology allowed security teams to place Operational Technology (OT) security in a separate category than overall IT security. Those days are over.
A series of high-profile, costly, and disruptive attacks have exposed weaknesses in OT, sparking a wave of new regulations aimed at bolstering security in critical industries such as electrical utilities and oil & gas pipelines. Heightened regulatory scrutiny is occurring in parallel with a steady convergence of traditional IT and OT as systems increasingly interact and overlap with a sharp rise in connectivity and data at the edge.
The answer to this problem is a unified, real-time view across an organization’s IT and OT environments. This enables better collaboration between IT, security, and operations teams, enhances security posture, improves uptime, and ensures safety and compliance.
You can use the Splunk platform to run searches, for example, to detect an OT asset communicating with external systems successfully (inbound or outbound). If you're an Splunk Enterprise Security user, you can also use the OT Security Add-On for Splunk to expand existing Splunk Enterprise Security frameworks to improve security visibility in OT environments.
How to use Splunk software for this use case
Run the following search. You can optimize it by specifying an index and adjusting the time range.
| tstats count min(_time) AS firstTime max(_time) AS lastTime
    FROM datamodel=Network_Traffic
    WHERE All_Traffic.action=allowed AND
    BY All_Traffic.src All_Traffic.dest All_Traffic.dest_port All_Traffic.action
| rename All_Traffic.* AS *
| eval is_external_destination=if(`is_external(dest)`, true, false), is_external_source=if(`is_external(src)`, true, false)
| eval is_ot_source=if(`is_ot_asset(src)`, true, false), is_ot_destination=if(`is_ot_asset(dest)`, true, false)
| search (is_ot_source=true AND is_external_destination=true) OR (is_ot_destination=true AND is_external_source=true)
| eval direction=if(is_ot_source, "outbound", "inbound")
Search explanation
The table provides an explanation of what each part of this search achieves. You can adjust this query based on the specifics of your environment.
| Splunk Search | Explanation |
|---|---|
|
|
Search the network traffic data model for traffic being allowed. This search could be further refined to only search network traffic that involves an OT network or OT perimeter device or to also analyze blocked connections for suspicious activity. |
|
|
Rename fields returned from the data model to remove the prefix of |
|
|
Use the Splunk Enterprise Security macro |
|
|
Use the Splunk Enterprise Security macro |
|
|
Tests for two different scenarios and filters down the result appropriately:
|
|
|
Labels the direction of the connection as inbound (source is external) and outbound (destination is external). |
Using the OT Security Add-On for Splunk
If you're an Splunk Enterprise Security user, you can use the OT Security Add-On for Splunk to expand existing Splunk Enterprise Security frameworks to improve security visibility in OT environments. This add-on provides capabilities in three primary areas:
- Expanded ability to ingest and monitor OT Assets
- Improved OT vulnerability management including support for Mitre ATT&CK for ICS
- Interfaces and reports to support NERC CIP audit and compliance
The OT Security Add-On for Splunk is built to enable improved integration with leading OT security technologies including inventory discovery and management systems, network monitoring and anomaly detection solutions, endpoint monitoring and patch management tools. Splunk experts have worked closely with many leading OT security vendors, including Dragos, Nozomi, Claroty and others to enable high value data access and visibility.
Dashboard examples
OT Perimeter Monitor
The OT Perimeter Monitor dashboard is designed to provide an overview of the perimeter of an OT system as defined in the get_perimeter_devices macro. It focuses on traffic traversing in and out of the security perimeter and whether it is allowed, blocked, and/or perimeter based on a combination of the interesting_ports_lookup and prohibited_traffic_lookup_by_category lookup definitions. The interesting_ports_lookup allows you to proactively identify traffic and the associated application.
For example, a user could include port TCP 502 as an interesting port and label it as the app Modbus. Using the prohibited traffic lookup file they could then specify that traffic on TCP port 502 is prohibited between an OT zone and corporate zone. Another common example is internet traffic outbound from the OT zone to another zone. Each of these lookup tables supports wildcards for fields as well.
While in many cases this traffic should be blocked automatically via the perimeter, this dashboard helps validate that these assumptions are correct. In addition, the dashboard provides changes in traffic, such as new ports or significant changes in traffic volumes.
.png?revision=1)
OT Asset Investigator - Asset Details
This dashboard provides information that is known about an asset, such as its characteristics, classifications, and physical location (when latitude and longitude are provided). In addition, the dashboard contains several high-level indicators including known vulnerabilities related to this asset, any notable events, as well as any traffic that has been detected as prohibited. Scroll down from here to view further dashboards in the OT Asset Investigator area.
.png?revision=1)
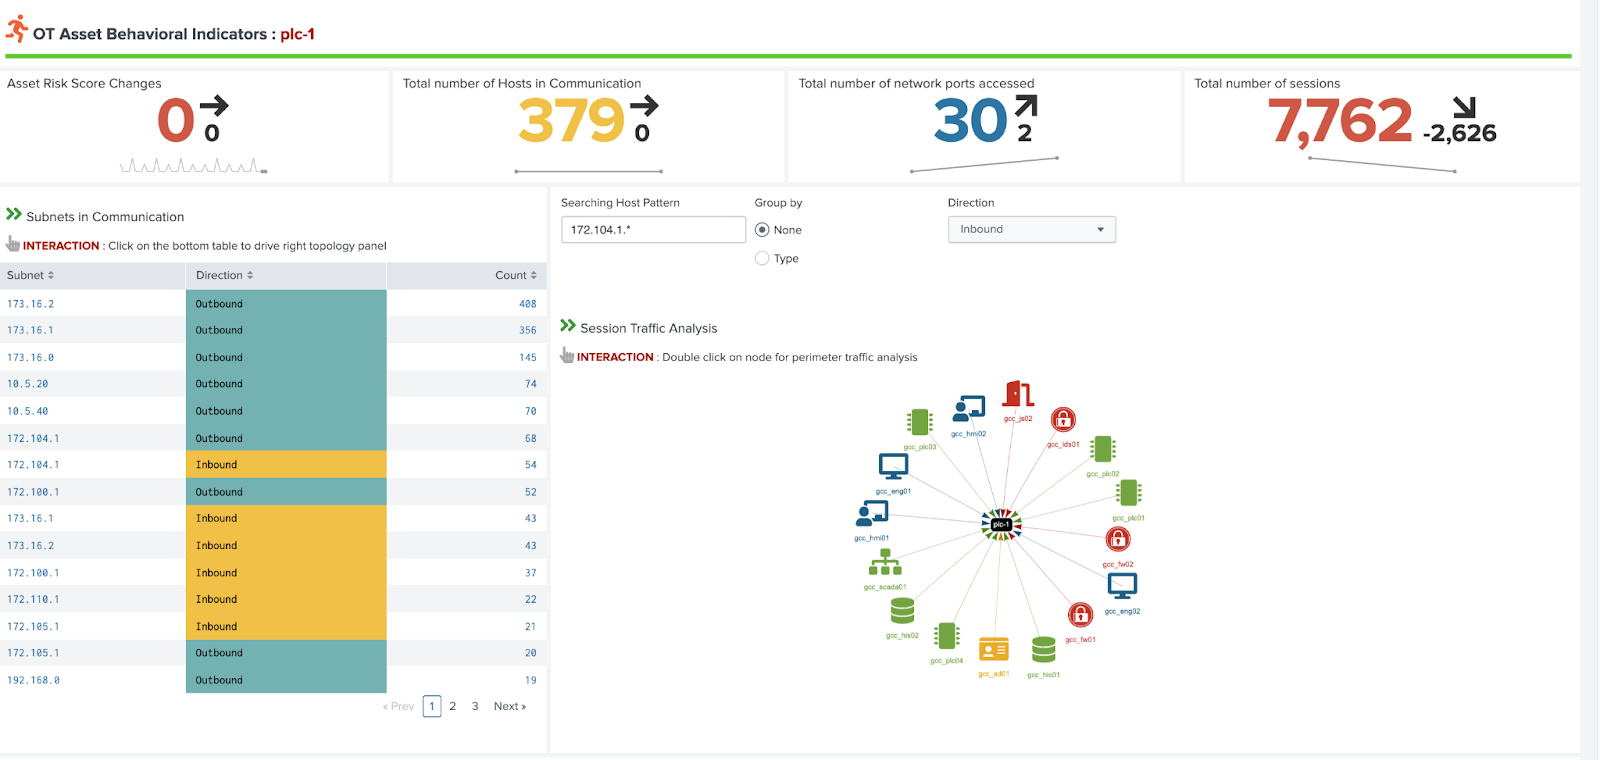
OT Asset Investigator - OT Asset Behavioral Indicators
The OT Asset Behavioral Indicators provide base metrics on the networking behavior of the selected asset and visualizes the types of communication with others hosts in the environment. This can prove important when trying to identify for example communication that should not be permitted between subnets. You can click on the subnets listed on the left to filter the network communication graph on the right-hand side.
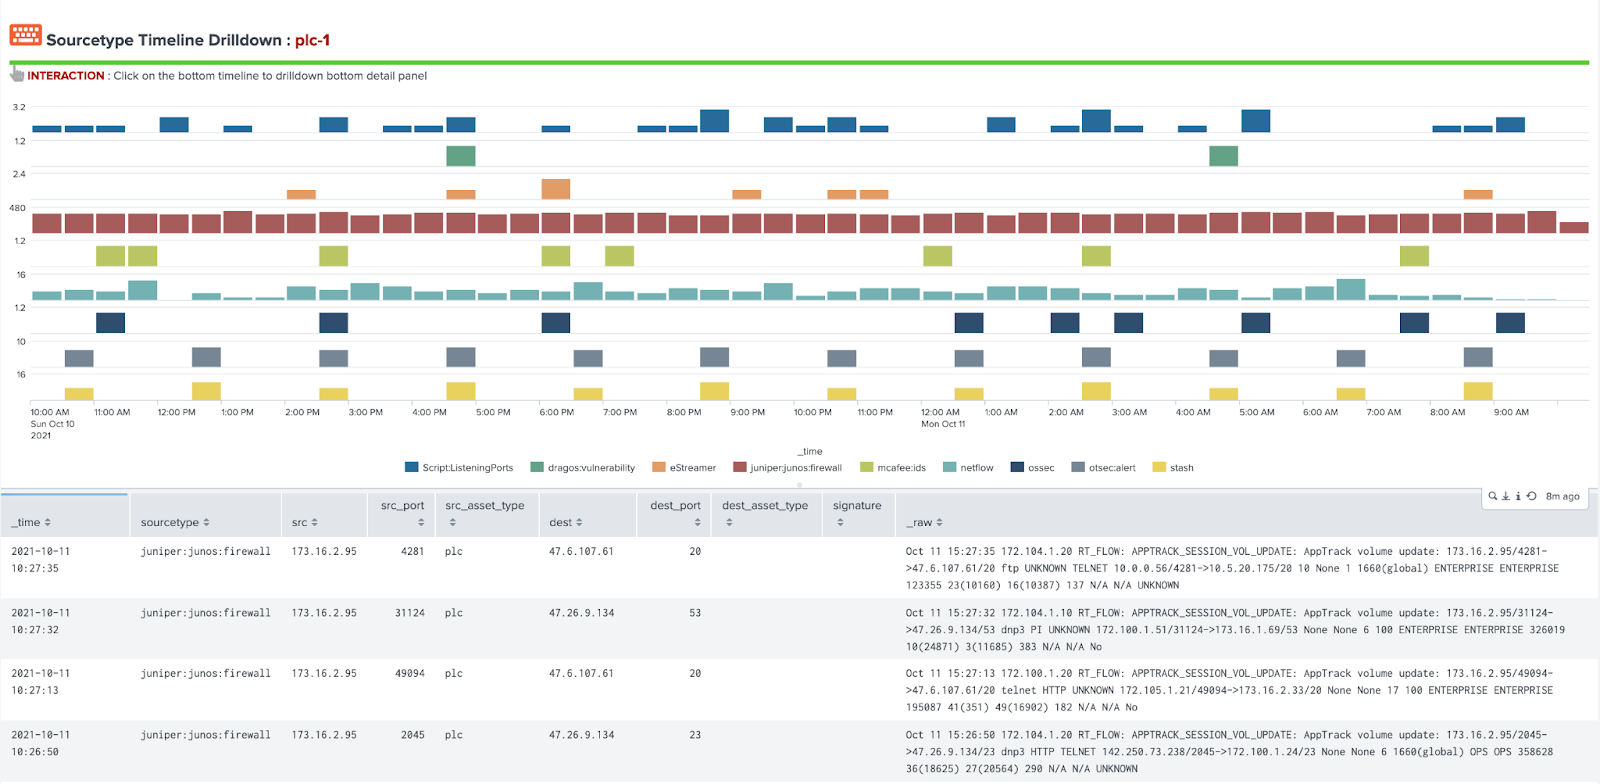
OT Asset Investigator - Sourcetype Timeline Drilldown
The drilldown shown in the final section of the OT Asset Investigator area provides information around data sources which contain the selected asset and can help guide analysis to different data sources to investigate. By selecting a data source in the bottom panel, analysts can quickly drill down into a search showing that data source and the asset selected for ad hoc analysis.
Next steps
These resources might help you understand and implement this guidance:
- Splunk Resource: The CISO’s guide to complete security for industrial control systems
- Splunk Resource: Protecting operational technology with Splunk
- Splunk Blog: Introducing a new Splunk add-On for OT security
- Splunk Blog: Splunk For OT Security: Perimeter and vulnerability evolution
- Splunk Blog: Baselining and beyond: What's new in OT Security Add-On v2.2
- Splunk GitHub: OT Security Add-on for Splunk