Identifying and visualizing supply chain issues
The modern supply chain faces complexity in managing shipments across multiple locations, including international borders and regulatory requirements. Real-time visibility into inventory levels is often lacking, leading to stockouts and inefficient resource allocation. Manual data collection and fragmented systems cause delays, errors, and limited visibility. These issues result in customer dissatisfaction, business loss, and damaged brand reputation.
Data required
- GPS data
- Supplier and procurement data
- Inventory management system or warehouse stock data
- Location data (warehouse and distribution points)
How to use Splunk software for this use case
You can use the Splunk platform, along with some helpful Splunkbase apps, to visualize the supply chain, warehouse inventory, and schedule searches to automatically get updates on a regular basis.
- Splunk DBConnect can be used to pull locations and inventory data from a database.
- Splunk Location Tracker can be used to track multiple locations at once, for example, different warehouses or distribution areas.
Visualize the supply chain
The first step after getting the data in is to get the data onto a map. This will be for the assets that are both physical locations (for example warehouses, stores, or facilities) and the moving items that you want to track.
This can be done by using the data pulled from a geographic information system (GIS) database and visualized using the Splunk Location Tracker. A simple way to build this data set is to only pull out the parts you need. This will also have the bonus of making the dashboard fast, as it won’t contain any unused data.
You can use SPL that looks like this:
| index=<"location data index"> sourcetype=<"location data sourcetype">
| table _time latitude longitude identifierField
| sort -_time
Search explanation
| Splunk Search | Explanation |
|---|---|
| index=<"location data index"> |
Search the "location data index" index for the "location data sourcetype" source type. |
| table _time latitude longitude identifierField |
Select and display specific fields ( This search uses the |
| sort -_time |
Sort the events in descending order based on the _time field. The most recent events appear first in the output. |
Visualize warehouse inventory
The second step is showing what’s at each location. For this, you need warehouse and inventory data.
After your deployment is ingesting the inventory data for each location, you can show it on a map using the geostats command. The following is a sample search to achieve this:
| index=<"inventory data index">  sourcetype=<"inventory data sourcetype">
| stats count BY <"the things you want to count in your inventory">
| geostats latfield="latitude" longfield="longitude" count BY <"the thing you wanted to count earlier">
Search explanation
| Splunk Search | Explanation |
|---|---|
| index=<"inventory data index"> |
Search the "location data index" index for the "location data sourcetype" source type. |
| stats count BY <"the things you want to count in your inventory"> |
Perform a statistical calculation to count the occurrences of specific values in the selected fields from the filtered events. The specified fields are used for grouping and the resulting count is displayed for each unique value. |
| geostats latfield="latitude" longfield="longitude" count BY <"the thing you wanted to count earlier"> |
Generate geostatistical aggregations based on the latitude and longitude fields. The count of occurrences is displayed for each unique value of the "the thing you wanted to count earlier" field, and the corresponding geographic locations are visualized. |
Scheduling searches
The final step is to schedule these searches to run at an interval that makes sense for your data. For example, if items only move in and out of a facility daily, then running these searches once a day will be enough. However, if there are always items coming and going in your facilities then running this search every 5 minutes or maybe down to the minute might work better for you.
You can do this from inside dashboard studio by directly editing the JSON and setting the refresh field to your desired time frame. It should look something like this:
"reportNoScheduleWithRefresh": {
        "type": "ds.savedSearch",
        "options": {
            "ref": "Current Time",
                "refresh": "5s",
            "refreshType": "interval"
        },
If you don’t see the field “refresh” then you can just add the field into the JSON, then add the time interval, and it will schedule it for you.
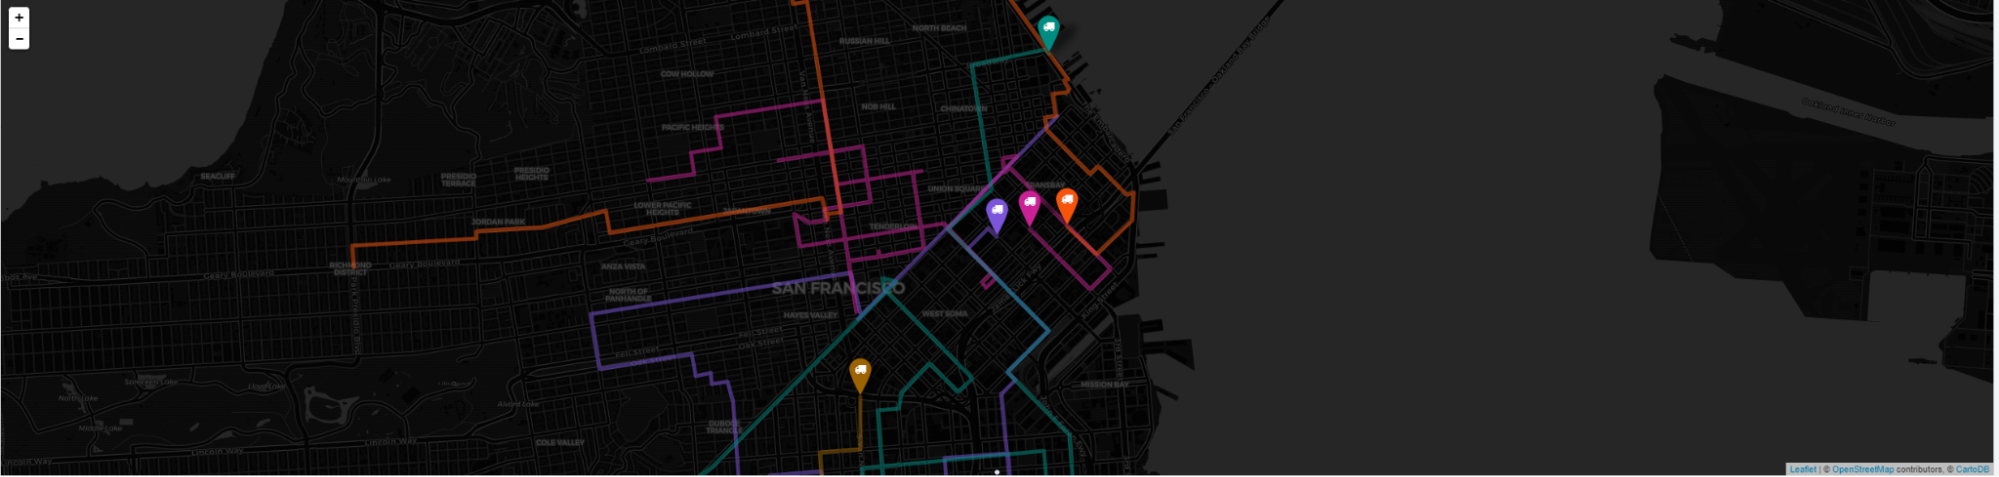
After you have everything loaded, you should have something that looks like this:
Next steps
Now that you have your supply chain logistics monitored, you can dive deeper into the efficiency of routes and find out more about where customers are requesting items. You can use that data to drive how and where you store things in your warehouses in order to provide a smoother and faster logistics process.
In addition, these resources might help you understand and implement this guidance:
- Splunk Blog: Everything supply chain
- Splunk Lantern Article: Manufacturing Use Cases