Monitoring equipment issues in real-time with predictive maintenance
Manufacturing organizations need to prevent equipment failure and minimize unexpected downtime, which can result in high costs, shortened life expectancy of machinery, inefficient time usage, safety issues, and a host of other business-impacting outcomes. Traditionally, scheduled maintenance has been used as a preventative measure for this situation. However, scheduled maintenance can result in the unnecessary replacement of components that are still performing optimally. Scheduled maintenance also assumes that the equipment has been run under certain conditions, when in reality an operator's conditions might deviate significantly from the conditions tested by the vendor.
Data required
How to use Splunk software for this use case
Predictive analytics is a strategy that uses machine learning algorithms trained with industrial data to make predictions about future outcomes, such as determining the likelihood of equipment and machinery breaking down.
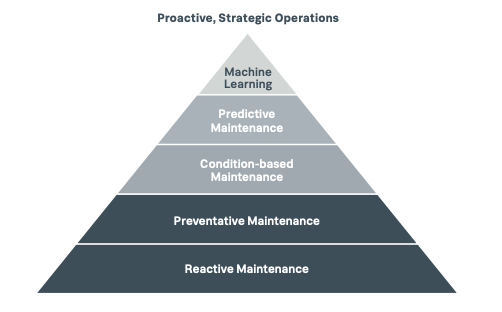
Using predictive analytics as a basis for maintenance strategies can help you determine issues outside of normal general usage of machinery and equipment. Your strategy will become based on performance and avoid the problems associated with scheduled maintenance. Both machine learning strategies and predictive maintenance techniques are essential to use if you're interested in moving from a traditional, reactive maintenance stance to a more proactive and strategic one.
Predictive maintenance is not a one-size-fits-all problem, so the Splunk Essentials for Predictive Maintenance app walks through an example of how to improve and optimize current preventative maintenance programs which you can build on to suit your needs. The app covers the methodology of predictive maintenance, from the essentials of analytics knowledge to practical predictive analytics. It introduces you to a complete predictive maintenance strategy implemented in a number of stages:
- Stage 1: Data collections and ingestion focuses on how you can use the Splunk platform to collect, store, and structure asset metrics.
- Stage 2: Data exploration covers key methods for pre-processing and exploring data to help you understand the type of data in use and the characteristics of the dataset.
- Stage 3: Predictive maintenance analysis teaches you anomaly detection, as well as unsupervised and supervised learning techniques.
- Stage 4: Operationalization shows you how to apply the model to a broader implementation, and how to create reports and alerts on these actions.
Dashboard examples
Splunk Essentials for Predictive Maintenance will also walk you through creating specialized dashboards for your unique use cases.
You can also use the Splunk AI Toolkit to utilize prebuilt predictive maintenance dashboards, as well as create more environment-specific dashboards.
The Predictive Maintenance dashboard in the AI Toolkit focuses on anomaly detection by monitoring at sensor values that are outside of standard deviations and outliers to a baselined process. This helps you to predict when unscheduled maintenance is needed.
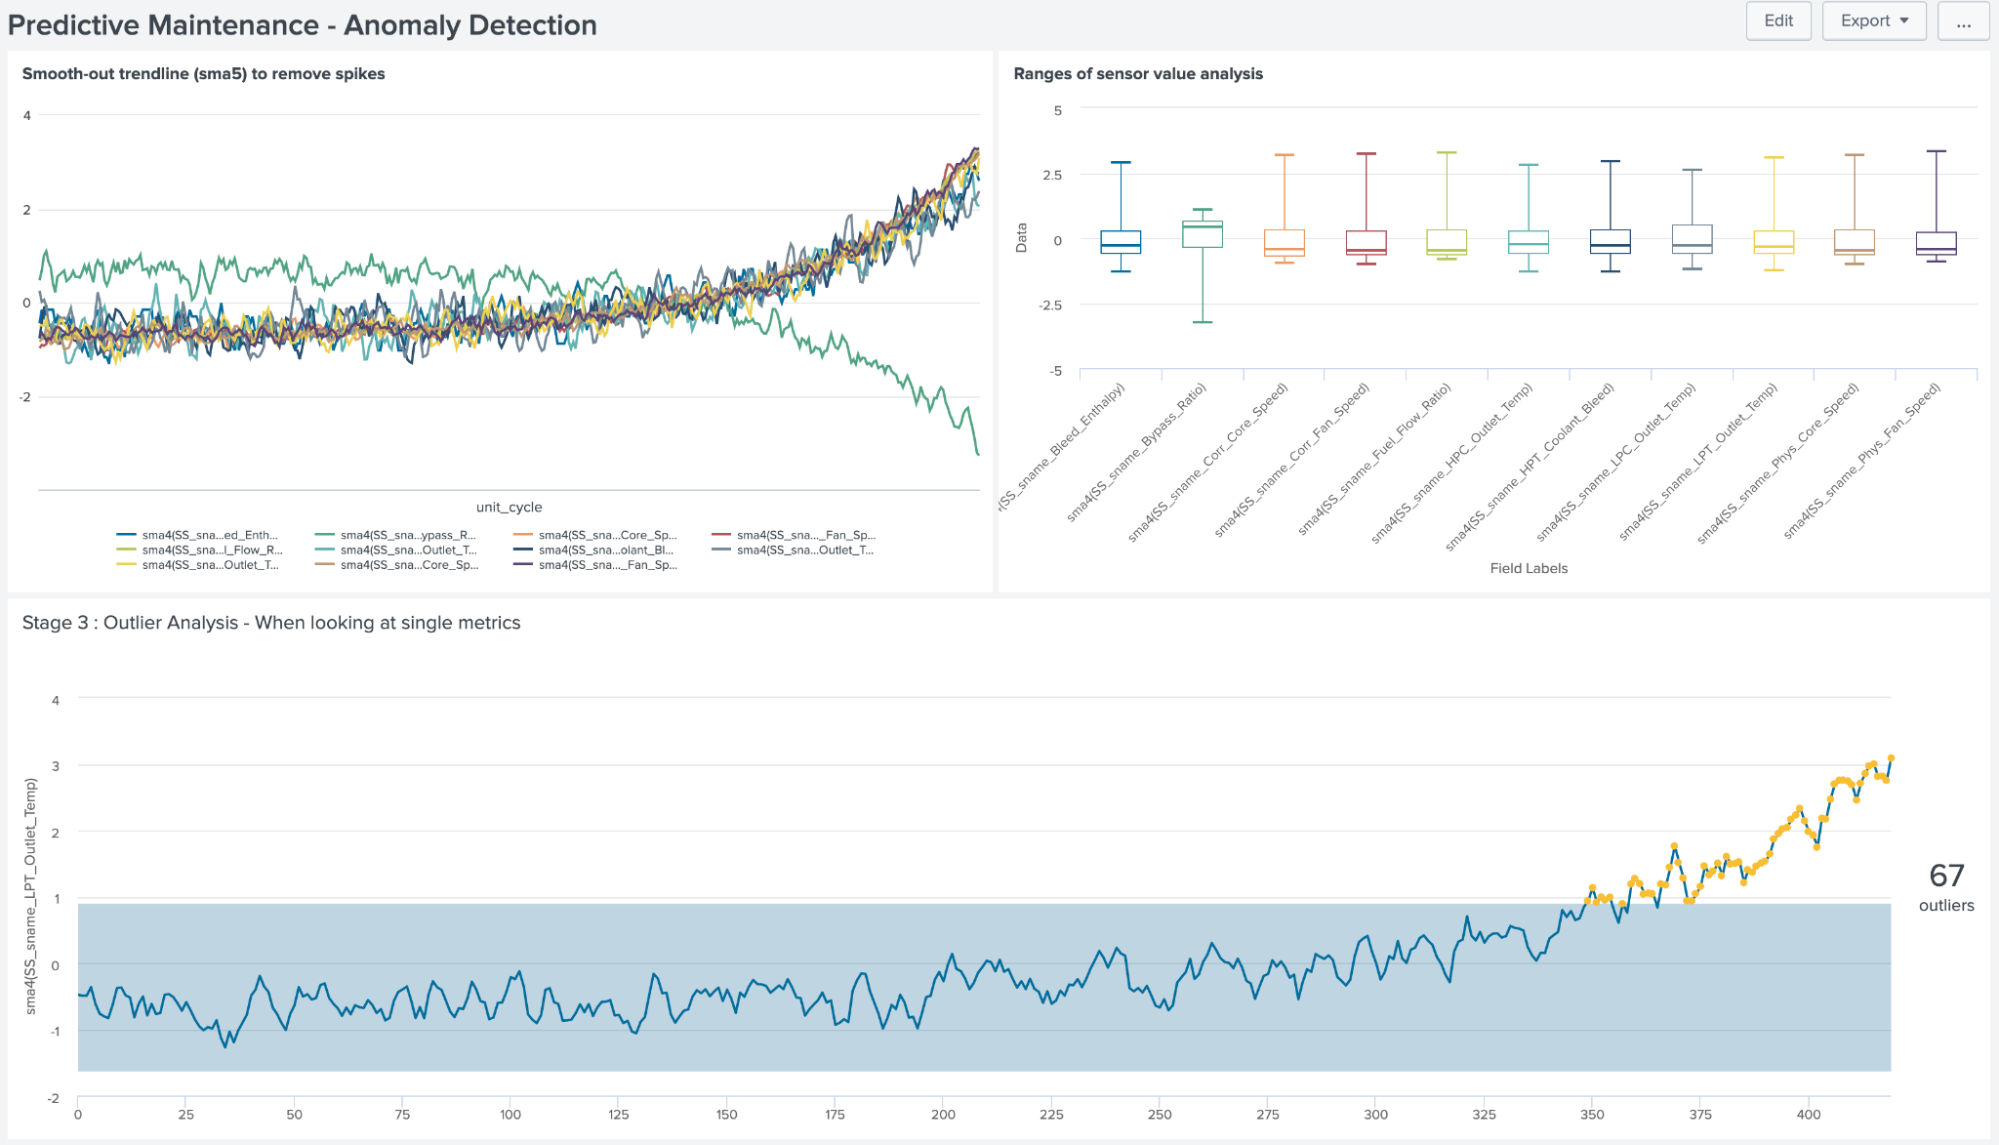
The SPL used in this dashboard to create the outlier chart at the bottom of the image above is:
| index=<machine_data_index> sourcetype=<machine_data_sourcetype>
| trendline sma4(SS_sname_Bleed_Enthalpy), sma4(SS_sname_Bypass_Ratio), sma4(SS_sname_Corr_Core_Speed), sma4(SS_sname_Corr_Fan_Speed), sma4(SS_sname_Fuel_Flow_Ratio), sma4(SS_sname_HPC_Outlet_Temp), sma4(SS_sname_HPT_Coolant_Bleed), sma4(SS_sname_LPC_Outlet_Temp), sma4(SS_sname_LPT_Outlet_Temp), sma4(SS_sname_Phys_Core_Speed), sma4(SS_sname_Phys_Fan_Speed)
| where unit_cycle>3
| table unit_cycle sma4(SS_sname_LPT_Outlet_Temp)
| eventstats avg("sma4(SS_sname_LPT_Outlet_Temp)") AS avg, stdev("sma4(SS_sname_LPT_Outlet_Temp)") AS stdev
| eval lowerBound=(avg-stdev*exact(1.8)), upperBound=(avg+stdev*exact(1))
| eval isOutlier=if('sma4(SS_sname_LPT_Outlet_Temp)' < lowerBound OR 'sma4(SS_sname_LPT_Outlet_Temp)' > upperBound, 1, 0)
| fields _time, "sma4(SS_sname_LPT_Outlet_Temp)", lowerBound, upperBound, isOutlier
Search explanation
| Splunk Search | Explanation |
|---|---|
| index=<machine_data_index> sourcetype=<machine_data_sourcetype> |
Search the machine data index for the machine data source type. |
| trendline sma4(SS_sname_Bleed_Enthalpy), sma4(SS_sname_Bypass_Ratio), sma4(SS_sname_Corr_Core_Speed), sma4(SS_sname_Corr_Fan_Speed), sma4(SS_sname_Fuel_Flow_Ratio), sma4(SS_sname_HPC_Outlet_Temp), sma4(SS_sname_HPT_Coolant_Bleed), sma4(SS_sname_LPC_Outlet_Temp), sma4(SS_sname_LPT_Outlet_Temp), sma4(SS_sname_Phys_Core_Speed), sma4(SS_sname_Phys_Fan_Speed) |
Trend a simple weighted average (sma) over 4 periods for multiple values. |
| where unit_cycle>3 |
Limit the results to unit_cycle greater than 3. |
| table unit_cycle sma4(SS_sname_LPT_Outlet_Temp) |
Specify the fields to include in the output table, selecting the unit_cycle field and the sma4(SS_sname_LPT_Outlet_Temp) field. |
| eventstats avg("sma4(SS_sname_LPT_Outlet_Temp)") AS avg, stdev("sma4(SS_sname_LPT_Outlet_Temp)") AS stdev |
Generate avg and standard deviation summary statistics from SS_sname_LPT_Outlet_Temp and save those statistics in new fields avg and stdev. |
|
|
Define lower and upper boundaries based on avg +/- stdev and identified outliers outside of defined boundaries. |
| fields _time, "sma4(SS_sname_LPT_Outlet_Temp)", lowerBound, upperBound, isOutlier |
Limit the fields to what is needed to generate the outlier chart, by removing fields only used for calculations. |
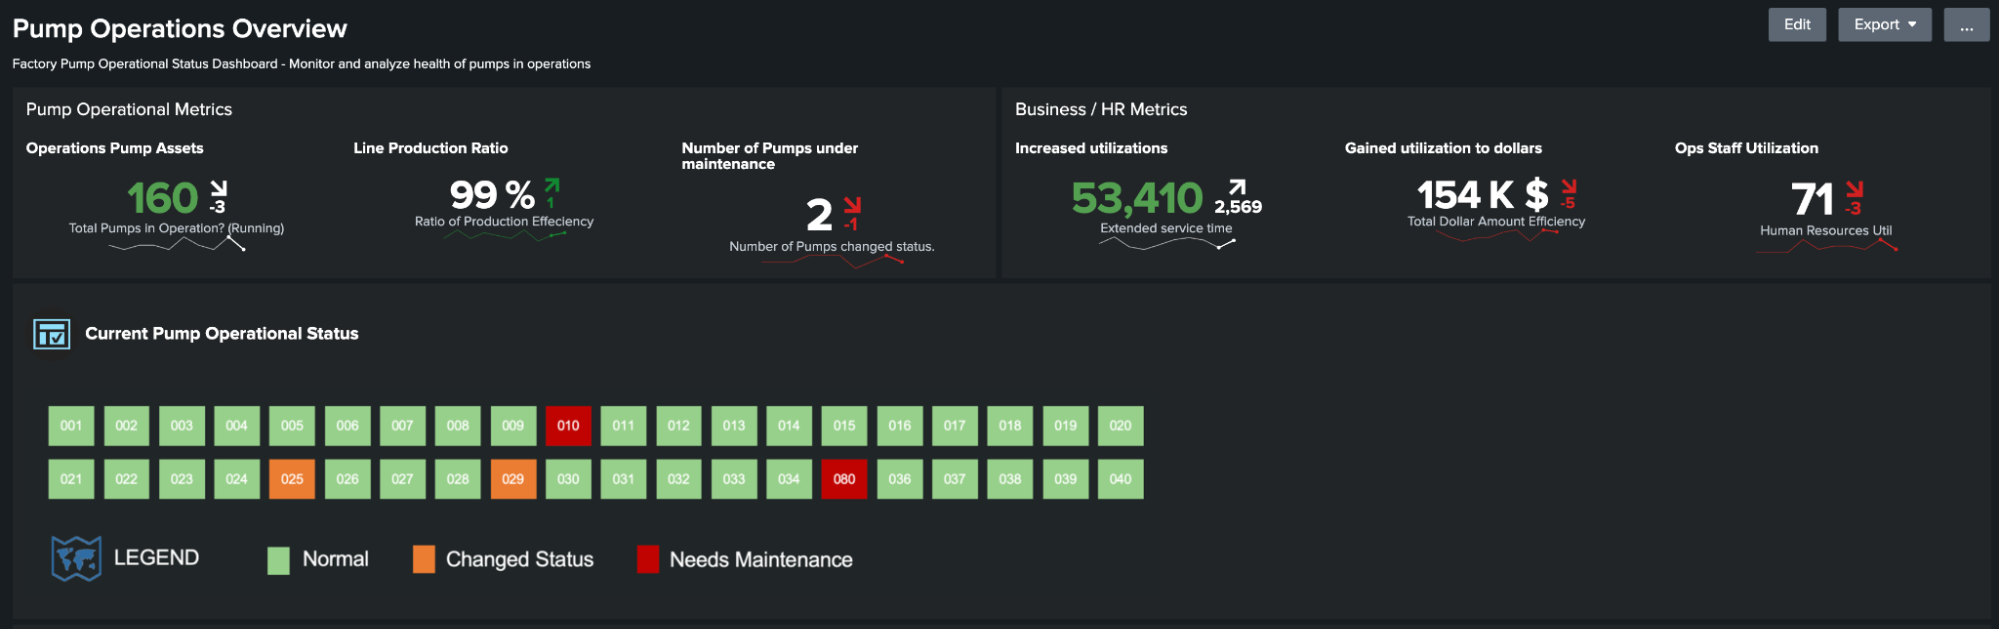
Another similar dashboard in Splunk Essentials for Predictive Maintenance is the Pump Operations Overview dashboard. This dashboard shows an overview of pumps in a facility with KPIs running across the top and status of the currently monitored pumps on the bottom. The outliers shown in this dashboard are created in a similar way to the example shown above, and can be customized to suit your needs.
Next steps
After you have these dashboards set up, you can create alerts when statuses change, allowing you to take action before larger issues occur.
Additionally, these resources might help you understand and implement this guidance:
- Splunk Blog: Getting started with machine learning at Splunk
- Splunk Blog: What is predictive maintenance?
- Splunk Blog: What is IoT monitoring?
- Splunk Resource: Recursion Pharma targets 100 genetic diseases with Splunk and machine learning