Preparing data for use with the Splunk AI Toolkit
The Splunk AI Toolkit (AITK) provides you with step-by-step guided workflows to build and deploy models for common business challenges. But before you jump in and start to create models, you should first spend some time preparing your potential data.
How to use Splunk software for this use case
Preparing and cleaning the data
Preparing and cleaning data involves modifying the raw data to make it consistent and organized enough to input into your analytical algorithm. This process is also referred to as munging or wrangling. It may involve creating some derived data, such as unique identifiers, and filling null or missing values.
Making data "tidy" is essential to fit a model effectively; variables or features should be the columns, and samples or data points should be the rows. It's worth noting that a common estimate suggests that about 80% of data science time is spent on data munging - it's a vital activity to ensure that your models work the way you intend.
There are a number of different SPL commands you can use to prepare and clean your data:
binputs continuous numerical values into discrete sets, or bins, by adjusting the value of<field>so that all of the items in a particular set have the same value. It's useful for making frequency distributions or histograms of numerical data.makecontinuousmakes a field on the x-axis numerically continuous. Where no data exists, it adds empty bins. Where there is data, it quantifies the periods. You can usechartortimechartto invoke this new x-axis value.fieldsummaryprovides summary stats for all or a subset of fields in your search results. Summary information is displayed as a results table.kmeansdivides data into k clusters. Each data point belongs to the cluster with the nearest mean (centroid) and is partitioned into Voronoi cells. Here is an example of a map created with this data.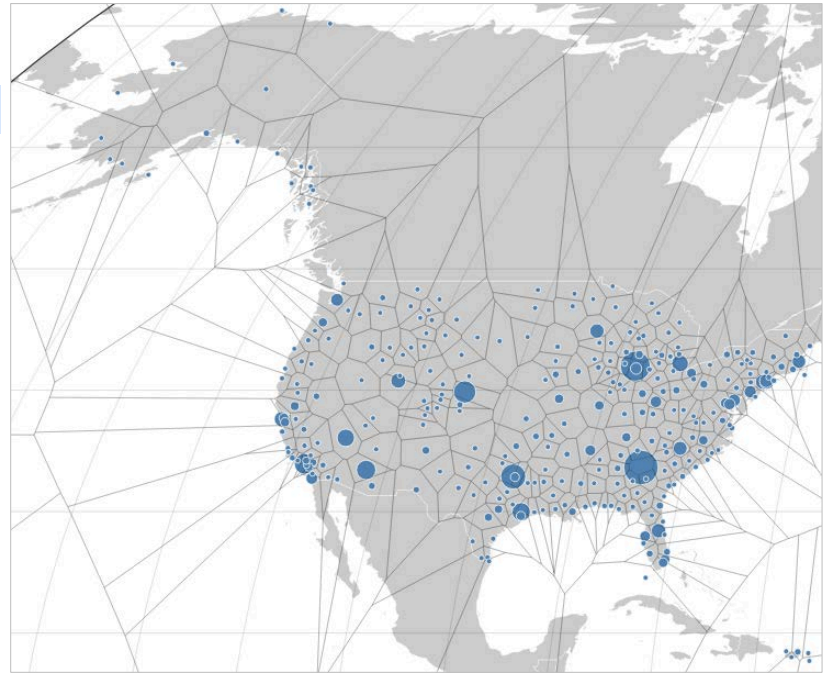
clustergroups events based on patterns detected in event text streams. Clustering can find outlying data points in large volumes of data that might indicate significant events. You could use theclustercommand to seek out small group anomalies such as two successful logins from a terminated user, or large group anomalies such as a DDoS attack with thousands of similar events.associateidentifies correlations between fields. This command tries to find a relationship between pairs of fields by calculating a change in entropy (unpredictability) based on their values. This entropy represents whether knowing the value of one field helps to predict the value of another field.
Train/test split
Train/test split is a model validation process that allows you to simulate how your model would perform with new data. Test data is used to test the training data. The test data should be a random sample taken from data that the model has not been trained on.
To split the data, you can:
- use the
samplecommand to sample after results are collected from indexes - use event sampling to sample before results are collected from the indexes
- use time to split the data
- use a combination of these
The standard percentage for a train/test split is 70/30 and is the default used by the guided workflows. While you can experiment with different combinations of split percentages, you should use a larger split for training.
Here are two examples of splits:
Random split: A random split divides the dataset into training and test sets without preserving the distribution of the target variable. This can be done in SPL as follows:
<<data query>>
| sample partitions=100
| eval dataset = if(partition_number < 70, "train", "test")
Stratified split: A stratified split maintains the proportional distribution of the target variable (for example, "label") across both training and test sets. In SPL, this can be achieved with:
<<data query>>
| sample partitions=100
| sort 0 label partition_number
| streamstats count as label_count by label
| eventstats max(label_count) as max_label_count by label
| eval percentile = round(label_count * 100 / max_label_count)
| eval dataset = if(percentile <= 80, "train", "test")
Next steps
Preparing your data allows the relationships between the data to become more visible to you. After you find those relationships between the data, you can start to tell stories about the data. These stories will then act as a proxy for your model, allowing you to use machine learning data to answer important questions for your business, for example, why is this happening? What happens next? Or, what are the best business outcomes that can happen?
After you've identified a business problem by exploring your data, and created a train/test split, you can move on to finding all historic data relevant to the problem at hand, organizing a workflow and setting up new incoming data, then building, testing and operationalizing for anomalies, predictions, and clustering.
These Splunk resources might help you understand and implement this use case:
- Splunk Help: About the AI Toolkit
- YouTube: Splunk machine learning playlist
- Splunk Help: Machine learning cheat sheet