Law enforcement accident reconstruction
Required data
Procedure
The following searches are guidelines intended to help you get started. Depending on your data set, you may need to change field names or parameters. You can optimize the searches by specifying a time range.
By using data from a map application (such as Apple Maps) on the mobile device of someone involved in an accident, you can reconstruct key information about the vehicle's movements before, during, and after the accident. Among the data points you might want to collect and add to a dashboard for easy reference during the investigation are:
Total travel time
Knowing how long it took a suspect or victim to get from their origin to the point of the accident can help reveal whether the person was driving responsibly.
index="investigation" sourcetype="apple-maps-csv"
| reverse
| eval MPH = round(mps*2.23694,2)
| stats max(_time) AS maxtime min(_time) AS mintime
| eval difference=maxtime-mintime
| eval travelTime=strftime(difference,"%d:%H:%M:%S")
| rename travelTime AS "Travel Time"
| table "Travel Time"
Maximum speed
Maximum speed also reveals whether a person involved in the accident was driving responsibly.
index="investigation" sourcetype="apple-maps-csv"
| reverse
```| eval MPH = round(mps*2.23694,2) ```
| eval KPH = round(mps*3.6,2)
| stats max(KPH) AS "Max Speed",
| table "Max Speed"
Average speed
Although average speed can be calculated by distance and length of travel, the Splunk platform can do the work for you and display the value on a dashboard.
index="investigation" sourcetype="apple-maps-csv"
| reverse
| eval MPH = round(mps*2.23694,2)
| stats avg(MPH) AS avg_speed
| eval avg_speed = round(avg_speed,2)
| rename avg_speed AS "Avg. Speed"
| table "Avg. Speed"
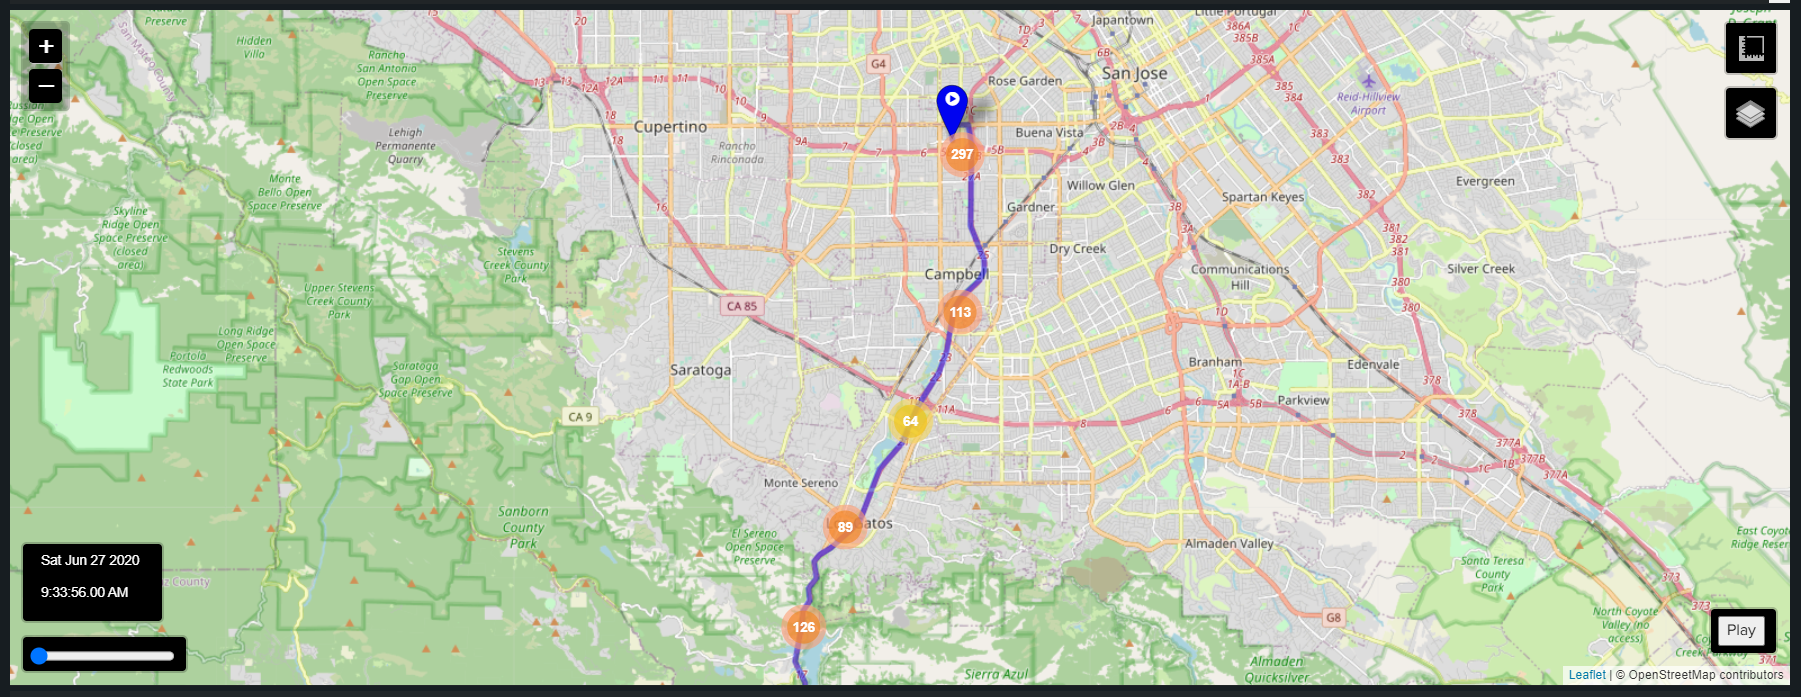
Key data points such as these can be combined with a map to approximate a person's location at various times throughout their travel.
For help creating map visualizations, try the Maps+ for Splunk app.
Some data sources may even allow you to graph a person's speed at exact times.
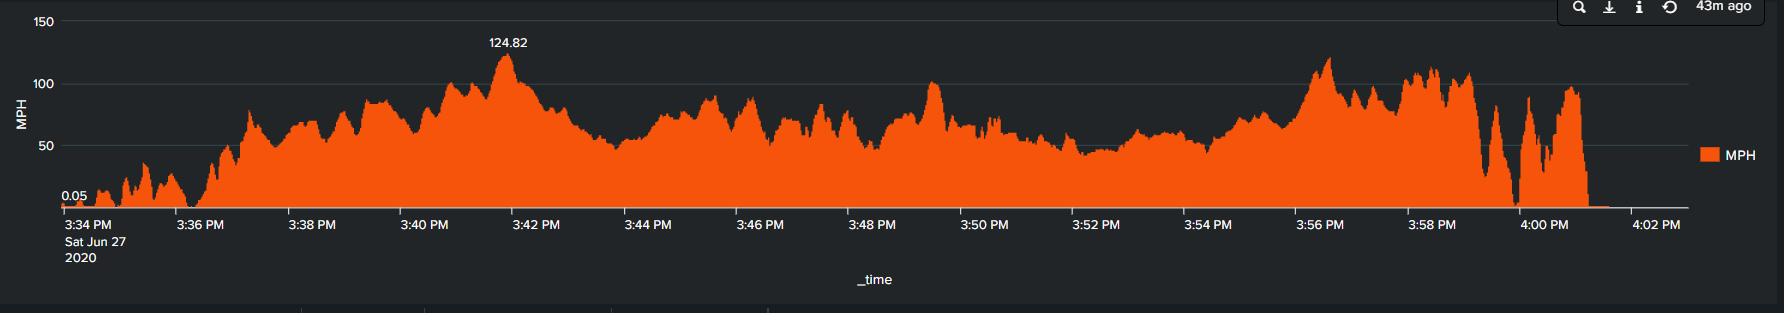
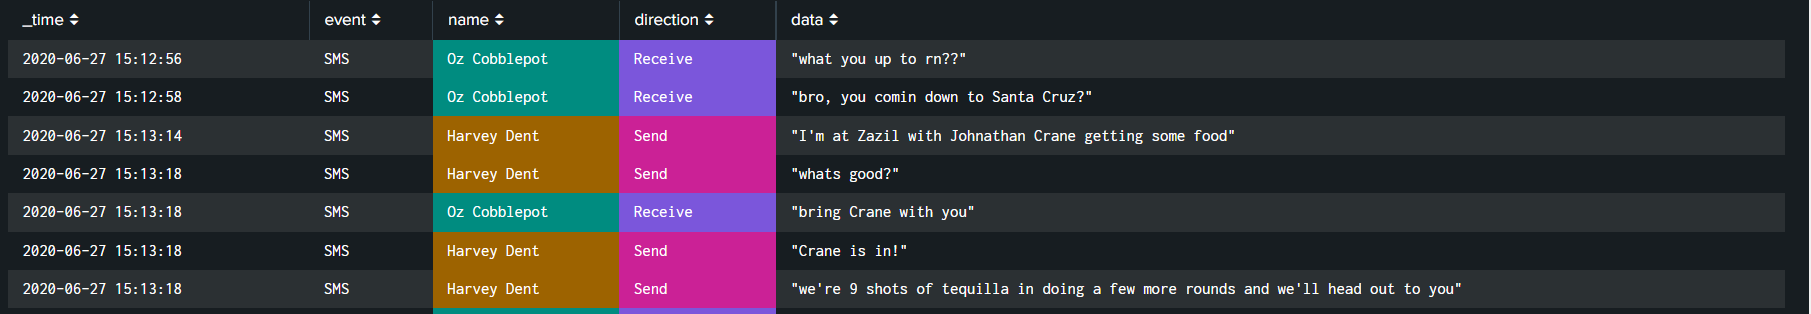
Data at that level of detail can be cross-referenced with other data - such as text messaging logs - to see if a suspect was driving distracted at the time the accident occurred.
source="cellebrite-messages.csv" host="harvey_dent" index="investigation" sourcetype="cellebrite-messages" data!=*snap*
| reverse
| table _time, event, name, direction, data
Next steps
Finally, you might be interested in other processes associated with the building a data-driven law enforcement strategy use case.