Using observability Related Content in Splunk Cloud Platform
You use Splunk Cloud Platform to provide visibility into your events, using petabyte-scale searches, federated data, AI/ML and data visualizations. But as you’re investigating an issue, Splunk platform logging can only give you part of the whole picture. You need more context and data, like metrics and traces, in order to pinpoint the root cause of an issue and troubleshoot it.
With observability Related Content in Splunk Cloud Platform, you can preview application and infrastructure data related to your log event directly in the Splunk Search and Reporting interface. This helps you to quickly pinpoint the root cause of your issue and get redirected to a purpose-built troubleshooting solution while staying in context.
Key benefits include:
- Immediate observability context by importing data previews and extra context from Splunk Observability Cloud for a particular event in Search and Reporting:
- Host
- Application Service
- Trace
- Kubernetes - Cluster, Pod, Node, Container
- Direct navigation in context to Splunk Observability Cloud for more information and purpose-built troubleshooting builds
- Available to Splunk Cloud Platform customers without Unified Identity
This article explores the configuration and usage of Related Content in Splunk Cloud Platform.
Configuration - Set up your API token and enable automatic UI updates
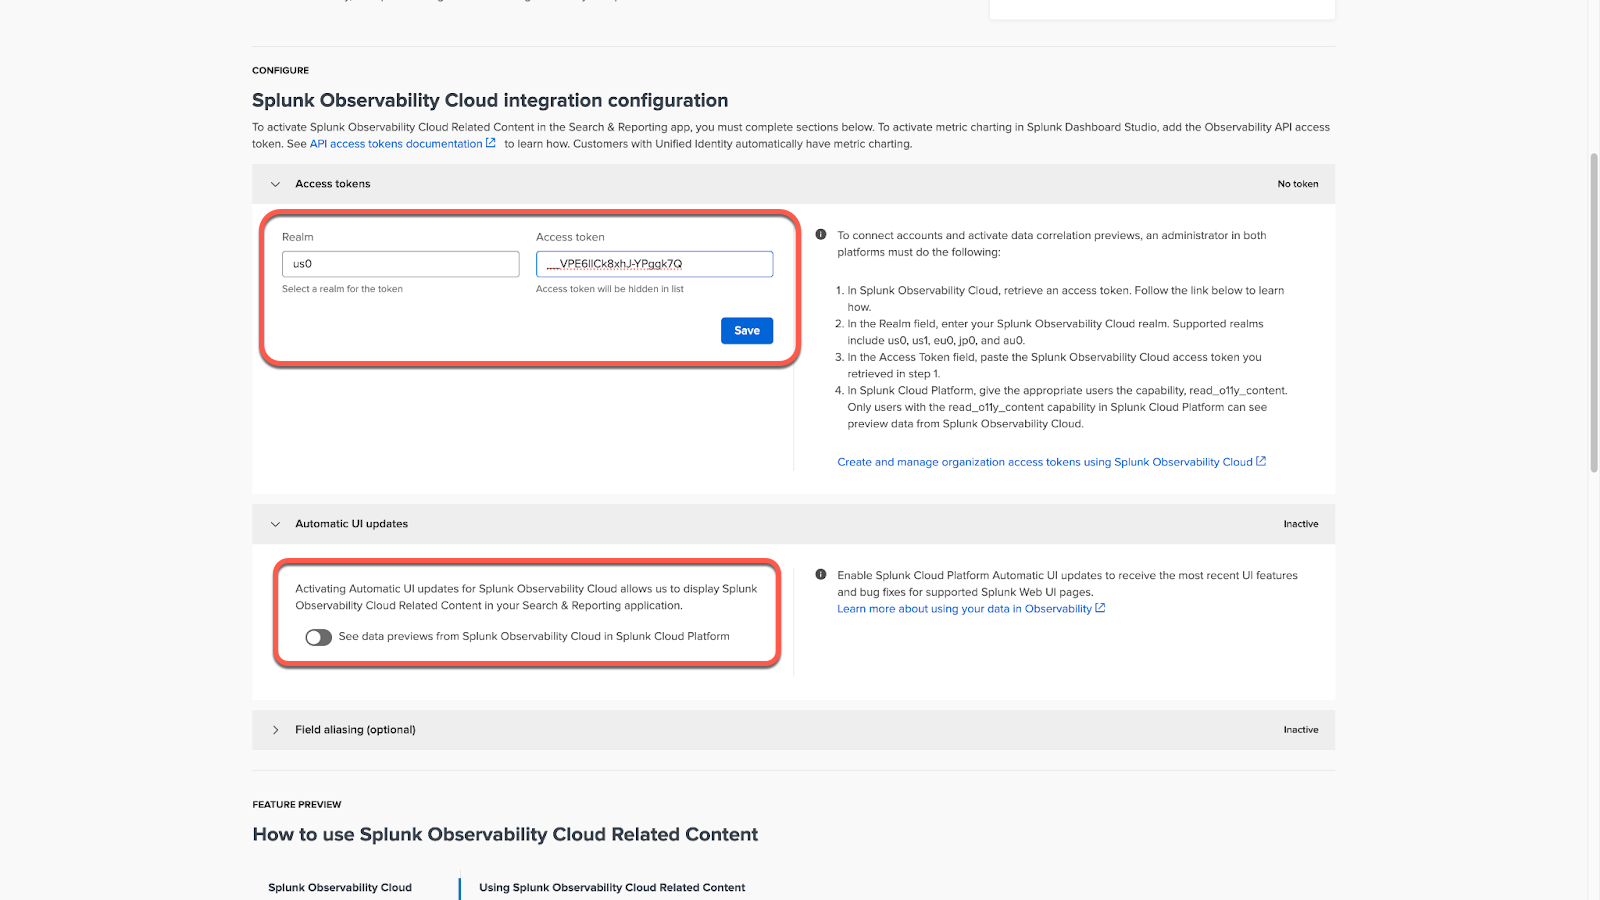
Click the Discover Splunk Observability Cloud app that is available in your Splunk Cloud Platform environment. If you have an admin role, you’ll see the configuration screen for adding in a Splunk Splunk Observability Cloud API token and turning on Automatic UI Updates. If you haven't already, follow the guidance in Docs to configure Splunk Observability Cloud previews.
You'll see that the app is pre-installed in your Splunk Cloud Platform stack. Click on it and you'll be taken to the configuration screen.

Add in your API Token and realm. Click Save to complete the first part of the configuration. Now scroll down and turn on the toggle under Automatic UI Updates from Splunk Observability Cloud.

Now, Related Content is activated in Splunk Cloud Platform. You can optionally enable Auto Field Mapping that maps potential fields in Search to OpenTelemetry fields used in Related Content.

Now you are ready to use Related Content in Splunk Cloud Platform. Make sure users who need to use this feature have the "read_o11y_content" capability attached to their Splunk Cloud Platform role.
Using Related Content in Splunk Cloud Platform
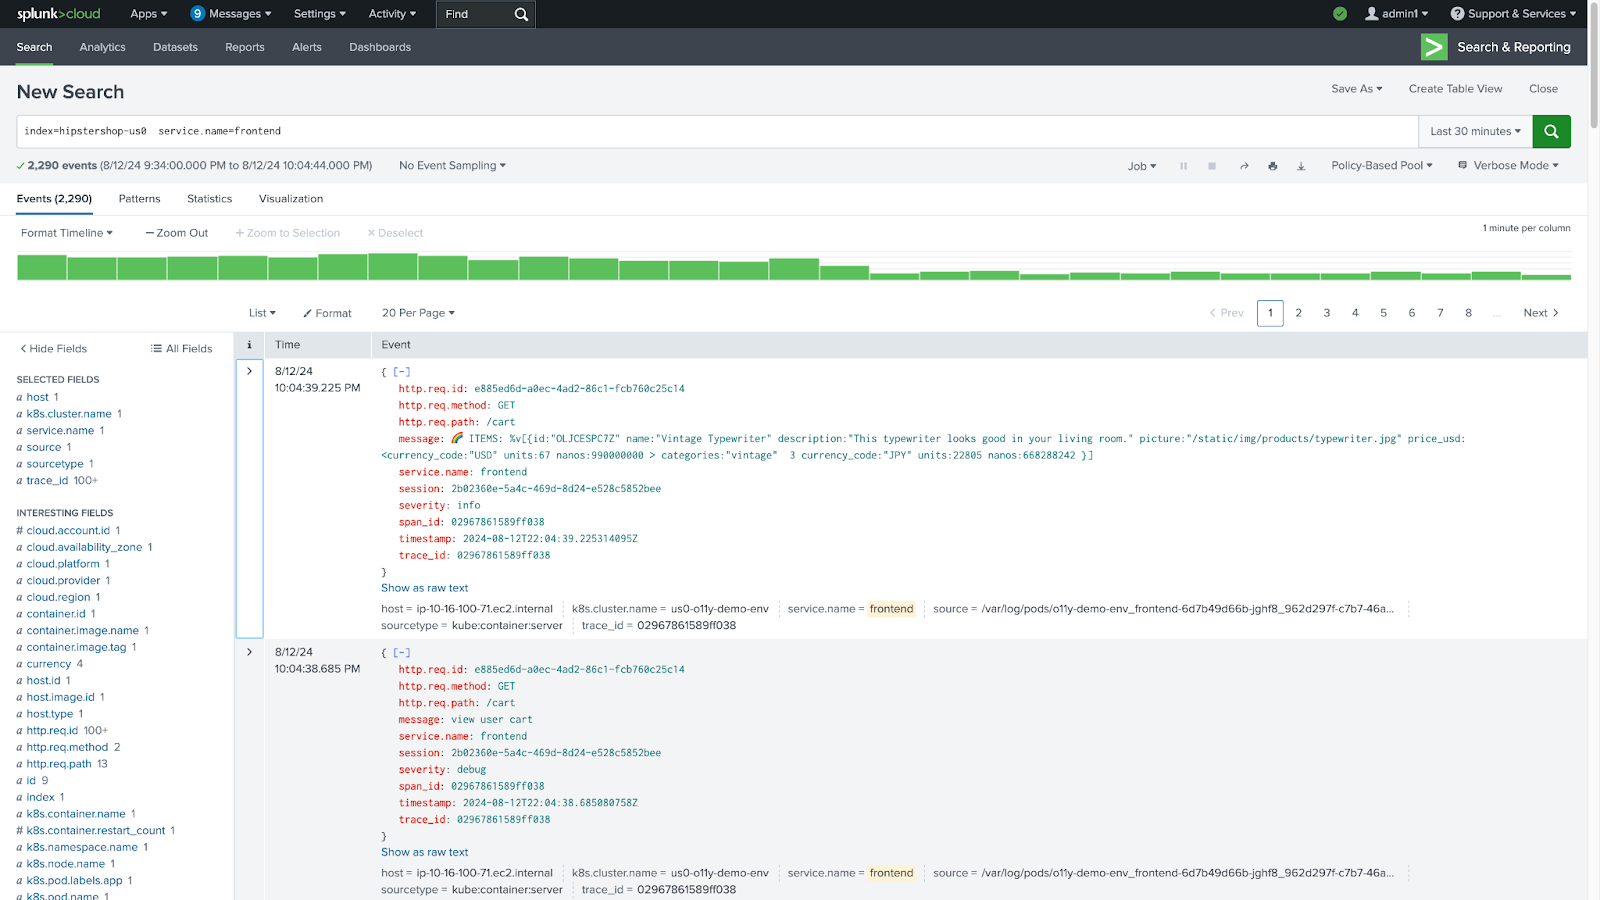
Navigate to the Search experience in any app of your choosing in Splunk Cloud Platform. In the following screenshot, we are using Search in Search and Reporting and are looking for an event related to an application log.

Before Related Content, you would need to take an application service name, trace or host, go to your observability product and re-orient to look at that view in your observability product alongside the Search event.
With Related Content, you can now expand an event you would like to investigate and see Preview links that are generated dynamically as the event is checked if the content is also available in Splunk Observability Cloud.

Clicking on the Preview link, you can see a preview of the Splunk Observability Cloud entity in Splunk Cloud Platform, without having to switch products. There are seven supported previews:
- Host
- Trace
- Application Service
- Kubernetes
- Cluster
- Node
- Pod
- Container
Clicking on the Preview link for host, you can see the following:

Click on the Preview link for trace_id to see the following:

Now, if you want to understand the service, click the Preview link for service.name to view an alert summary, mini Service map, Requests & Errors chart, and Latency chart.

If you want to navigate from Related Content in Splunk Cloud Platform to Splunk Observability Cloud, you can click the Open in APM link at the top of the side panel:

This navigates you in-context to the purpose-built view in Splunk Observability Cloud.

Next steps
These resources might help you understand and implement this guidance:

