Predicting failed trade settlements
You work in a brokerage. Starting in May 2024, the T+1 compliance directive mandates that all USA trades must be settled in one day at the most. Because of this, you want to provide resilience to the trade settlement process and prevent your organization from being penalized or suffering loss of reputation due to a lack of compliance.
Data required
How to use Splunk software for this use case
You can use the Splunk AI Toolkit to predict trade settlement failures.
This article shows you:
- A general process to predict the binary value of any categorical field
- How to define the characteristics of trade settlement failures
- How to fit the models
- How to apply the models to trade settlements
A general process to predict the binary value of any categorical field
- Download and install the free app, Splunk AI Toolkit and its associated app, the OS platform-dependent Python for Scientific Computing for Windows, Linux or Mac from Splunkbase.
- Ingest events for your use case into the Splunk platform just like any other events, or use a CSV file containing fields which represent real-world data combinations to create your training data. You could prepare or create a CSV file of relevant fields from the ingested data (use the
fieldscommand along with the Export button) to train your AI Toolkit model. You will ingest events into the Splunk platform to apply your trained models against them. - Extract relevant fields for your use case, especially for the real world data that will be used to predict the category value of a field. If the data is structured, the Splunk platform can easily extract it by itself. If the data is unstructured in any arbitrary format, you can use the Splunk Web Interface to extract fields from the GUI. If you know how to use regular expressions, the extraction becomes even easier. You only extract fields from the data relevant to the use case, and do this after the data is indexed.
- Consider using lookups to annotate your events with relevant fields for your use case, as not all your fields will be in the events. Lookups enrich the search from external sources such as CSV files, databases, output of an API or Splunk KVStore. Examples of added fields could include a person’s address, a DNS name, or details about an order.
- Train your model by using the guided workflow for experiments in the AI Toolkit. To illustrate a binary category prediction, the predicting telecom customer churn example from the AI Toolkit showcase under the predicting fields section is shown.
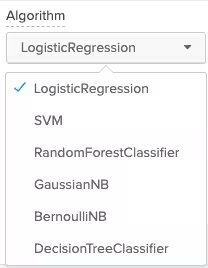
- Pick an algorithm for training the model. Consider trying out all the algorithms for your models and save at least two that are more precise. LogisticRegression is often the least precise in many use cases, and RandomForestClassifier often provides more precision. You can also add more algorithms from the Python for Scientific Computing, if needed.
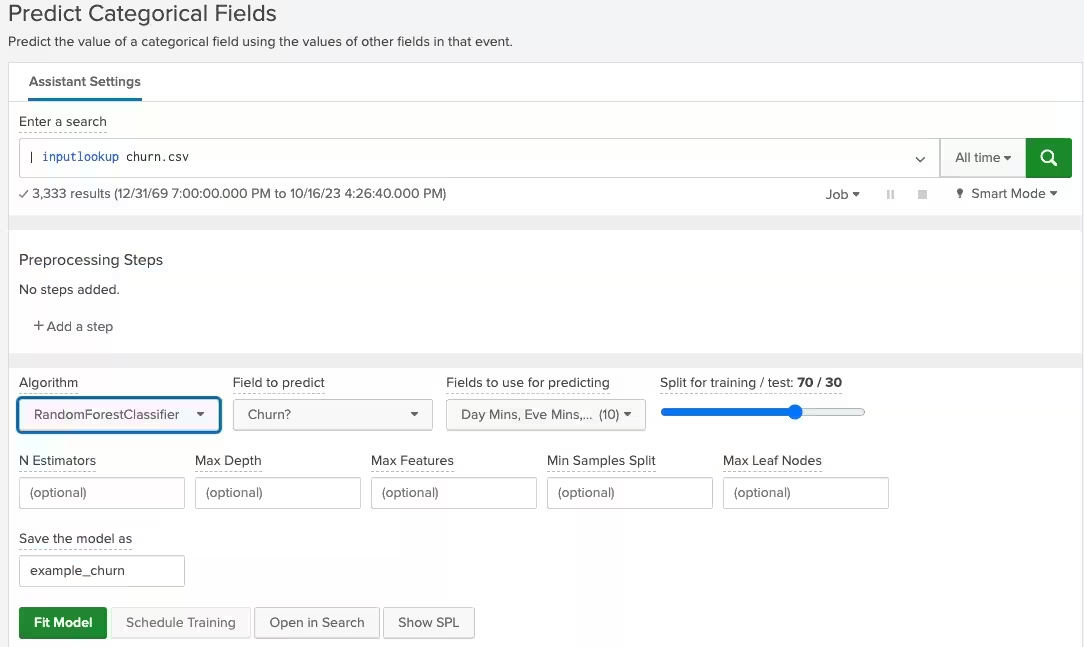
- Pick the field that you want to predict and all the supporting fields from the event data that will influence the prediction of the predicted field. Click the Fit Model button to run the test and save it to a model. The following screenshot shows an example of this process for predicting customer churn from the AI Toolkit showcase.
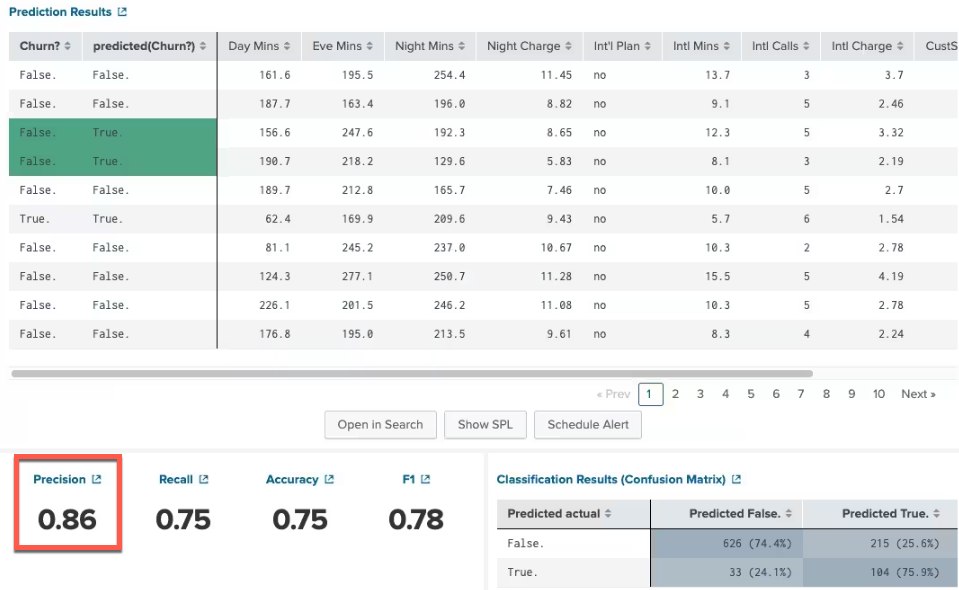
- At the bottom of this screen you can see the precision of your experiment. The closer you get to 1, the more accurate it is. If all your predictions are 100% accurate, your test data might be biased toward a particular outcome (overfit) and it may not reflect the real world data. There is a “confusion matrix” on the bottom right of the page, which explains how many false positives and false negatives were found.
- Now that you've saved some models, you can see how they can be applied to real world data. Run the following search to combine multiple models and assign a weight to each one:
index=some_index sourcetype=some_data_source <add more AND, OR, NOT to filter events>
| fields - predicted_field_name
|<add lookups to enrich with more fields>
|apply model1 AS model_rf|apply model2 AS model_lr
|...
|eval priorityscore_fieldname=if(model_rf="True.",100,0) + if(model_lr="True.",10,0) + … + <value of some other field>
|where priorityscore_fieldname > <some threshold>
|sort - priorityscore_fieldname
|table priorityscore_fieldname model_rf model_lr … <names of other fields>
This search applies multiple models to real world data to predict the categorical field in the data. This gives weights of importance to each model based on the model’s accuracy scores. In this example, model1 has 10 times more importance than model2 so its weight is assigned 100, while model2 is assigned 10. You can also add one of the fields from the data to the score as it may have a small influence on the accuracy of the predicted field.
In the AI Toolkit showcase example, the number of customer service calls is added to the score as that may also explain why the customer is leaving or causing churn. Here’s the search using the AI Toolkit showcase data and showing the prediction results.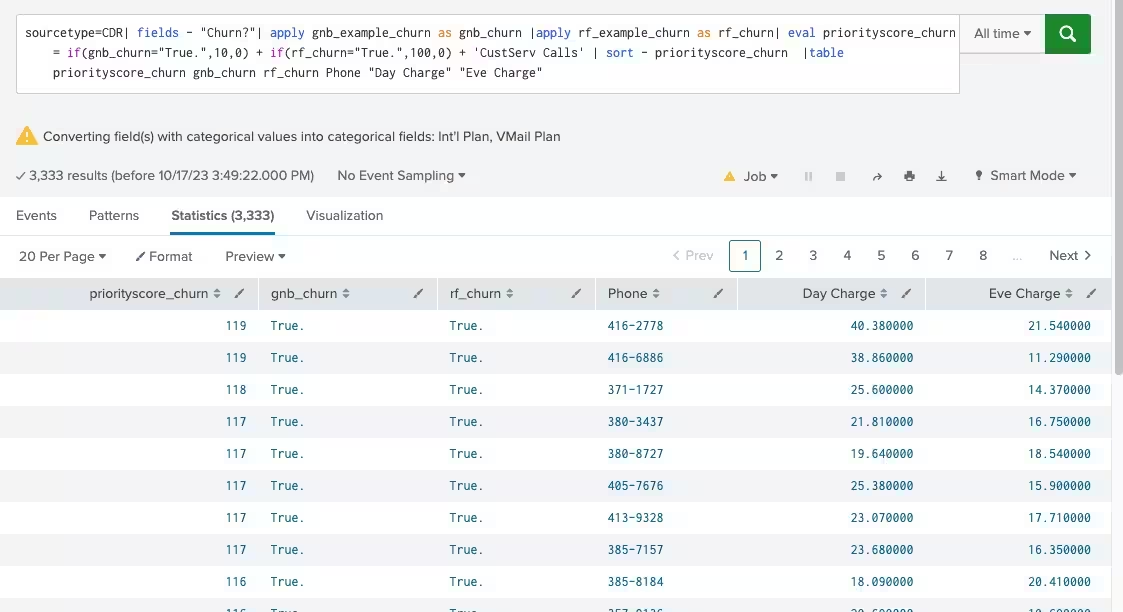
You can now apply this general approach to predict trade settlement failures.
Defining the characteristics of trade settlement failures
Instead of subjecting all trades to machine learning analysis, you should first identify trades prone to issues. These problematic trades can be filtered using Boolean logic based on specific characteristics indicating potential problems, even if they might not fail outright but have a high risk of doing so.
You should use your knowledge of what influences a trade settlement to fail to compile a list of characteristics. Some common characteristics are:
| Trades with a high probability of failure | Trades with a low probability of failure |
|---|---|
|
|
By collecting only the trades with a high probability of failure into a summary index, the dataset for analysis can be significantly reduced from a million trades to around 50,000 trades in the trade issues index. This refined dataset can then be examined in depth using machine learning models and searches, a step that is recommended before applying machine learning models to all trades.
Optionally, you could use machine learning to cluster trades by their characteristics if you cannot use boolean logic to separate trades into a trade issues index to apply models. The screenshot below shows the AI Toolkit being used to create a model that clusters trades by 3 features: number of shares, length of instructions, and allocation probability. Based on this, you can then collect the trade IDs for one cluster to send to the trades issues index to be applied to your category predictive models. In real world situations, the number of fields that can influence the failure of a trade will be a lot more than three, but three are used here as an example. Allocation probability is a feature that may not exist, as it in itself might require machine learning to compute, but it is used here for illustrative purposes.
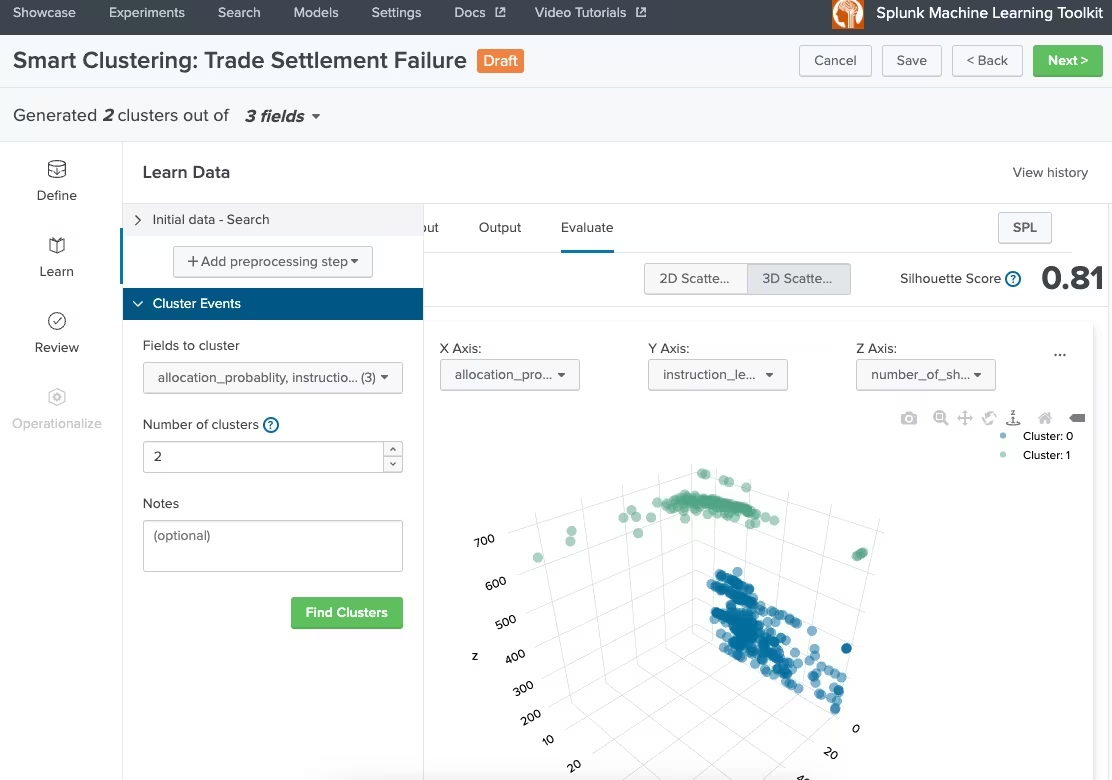
The algorithm used to create the cluster is kmeans . You can use the following SPL to divide the data into two clusters:
| inputlookup trade_training.csv
|table instruction_length,number_of_shares,allocation_probablity
| fit KMeans "allocation_probablity" "instruction_length" "number_of_shares" k=2 into "trade_cluster"
Fitting the models
Follow the steps in the general process example above to gather trade settlement events into the Splunk platform. Note that an event that logs the requirement to settle a trade with a trade ID will be missing multiple fields used to predict settlement failure unless the developer logs all required fields with the event, so you will need to use lookups to enrich the event with the fields that will influence the probability of failure. These fields can come from anywhere, such as a custom-built CSV file, a referential database, a CMDB, other Splunk ingested events, or a third-party API. It is recommended to have a training set with these fields already populated into a CSV file, and you can use lookups, the table command, and the Export button on Splunk web to do this.
Create models from training data. In this example, the predicted variable is called settlement and its values will be yes (this trade can settle in time) and no (this trade cannot settle in time and might fail to meet its settlement date). Random forest classifier and Gaussian naive bayes are used here as the algorithms to predict the settlement field.
| inputlookup trade_training.csv
|fit RandomForestClassifier settlement from "allocation_probabilty" "currencies" "instructions" "CUSIP" "odd_lot" "inventory" "ETF" "shares" "watch_list" "settlement_date" … into "settlement_model_rf"
| inputlookup trade_training.csv
|fit GaussianNB settlement from "allocation_probabilty" "currencies" "instructions" "CUSIP" "odd_lot" "inventory" "ETF" "shares" "watch_list" "settlement_date" … into "settlement_model_gnb"
Notice the … in the list of influenced fields, as there will be more to add based on your knowledge of what influences a trade settlement.
This experiment to create the model can also be created using the AI Toolkit workflow GUI as before. Since this is training data, the settlement field should be populated with actual yes and no values based on real world experience.
After you are satisfied with the precision results for the predicted settlement field with each model, you can use both models in a weighted manner to predict whether a trade will fail.
Applying the models to trade settlements
The AI Toolkit apply command is used for both models to apply to real-world datasets from an index that has already been populated with trades settlement request events that are suspected to have issues based on heuristics and boolean logic.
A simple example of heuristics is to use the Splunk platform to find out if any trade’s instruction length is three times the standard deviation plus the average length of all trade instruction lengths in a dataset. The thinking is that unusually long instructions will delay the trade settlement.
Here’s the SPL to apply the models to trade settlement events in a weighted fashion with priority scores for trades that should be investigated for possible settlement failure because the model has predicted that result. 10% of the length of the number of characters in the instructions has been added to the failure priority score.
index=trade_issues sourcetype=trades
|fields - settlement
|apply settlement_model_rf AS settlement_rf
|apply settlement_model_gnb AS settlement_gnb|
|eval instruction_length=len('Instructions') * 0.1
|eval priorityscore_failure=if(settlement_rf="No.",100,0) + if(settlement_gnb="No",10,0) + instruction_length
|where priorityscore_failure > 103
|sort -priorityscore_failure
|table priorityscore_failure settlement_rf settlement_gnb tradeID instruction_length allocation_probablity … currency
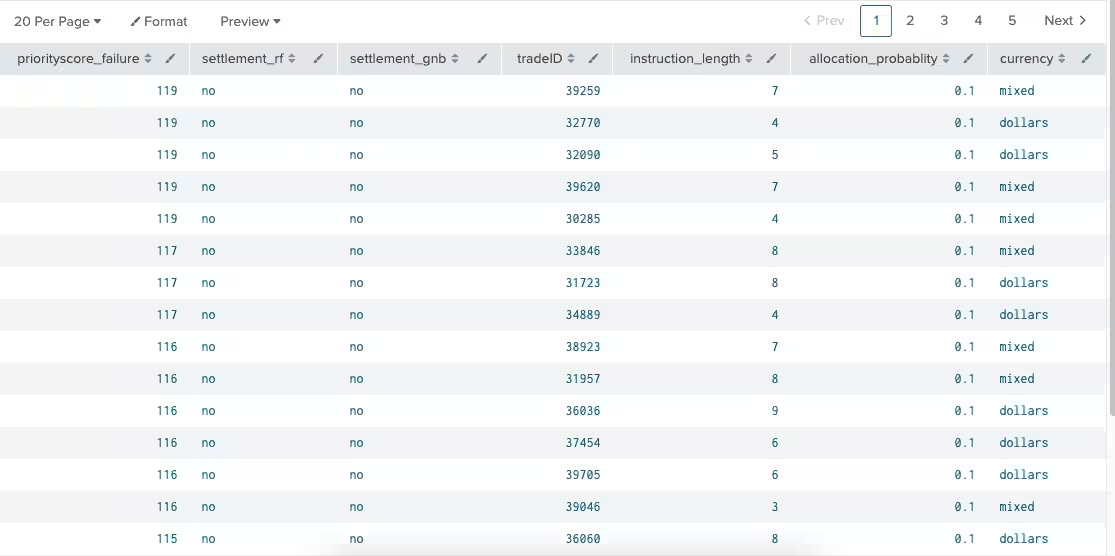
This process outputs a table of all trades that are predicted to fail based on at least two models and the length of the instructions. A trade settlement department can now start looking into where these trades are in the cycle to reconcile any issues before the trade settlement actually fails.
Next steps
When you know more information about what creates failed settlement cycles for a trade, that data can be fed back into the training data set to create more refined models.
You can also consider using the AI Toolkit to create numerical forecasting algorithms to predict the volume of failed trades for future days after you have a dependable forecast on whether a trade will fail to meet its settlement date deadline. Seasonal variation has to be taken into account, since January volatility, end of quarter days, and other outside factors have to be considered for this forecasting.